Reports and studies are some of the most time-consuming projects in PR.
After finishing the study part, there’s another challenge: how to present our results in a way that encourages people to read more and makes it easier for them to understand the main points.
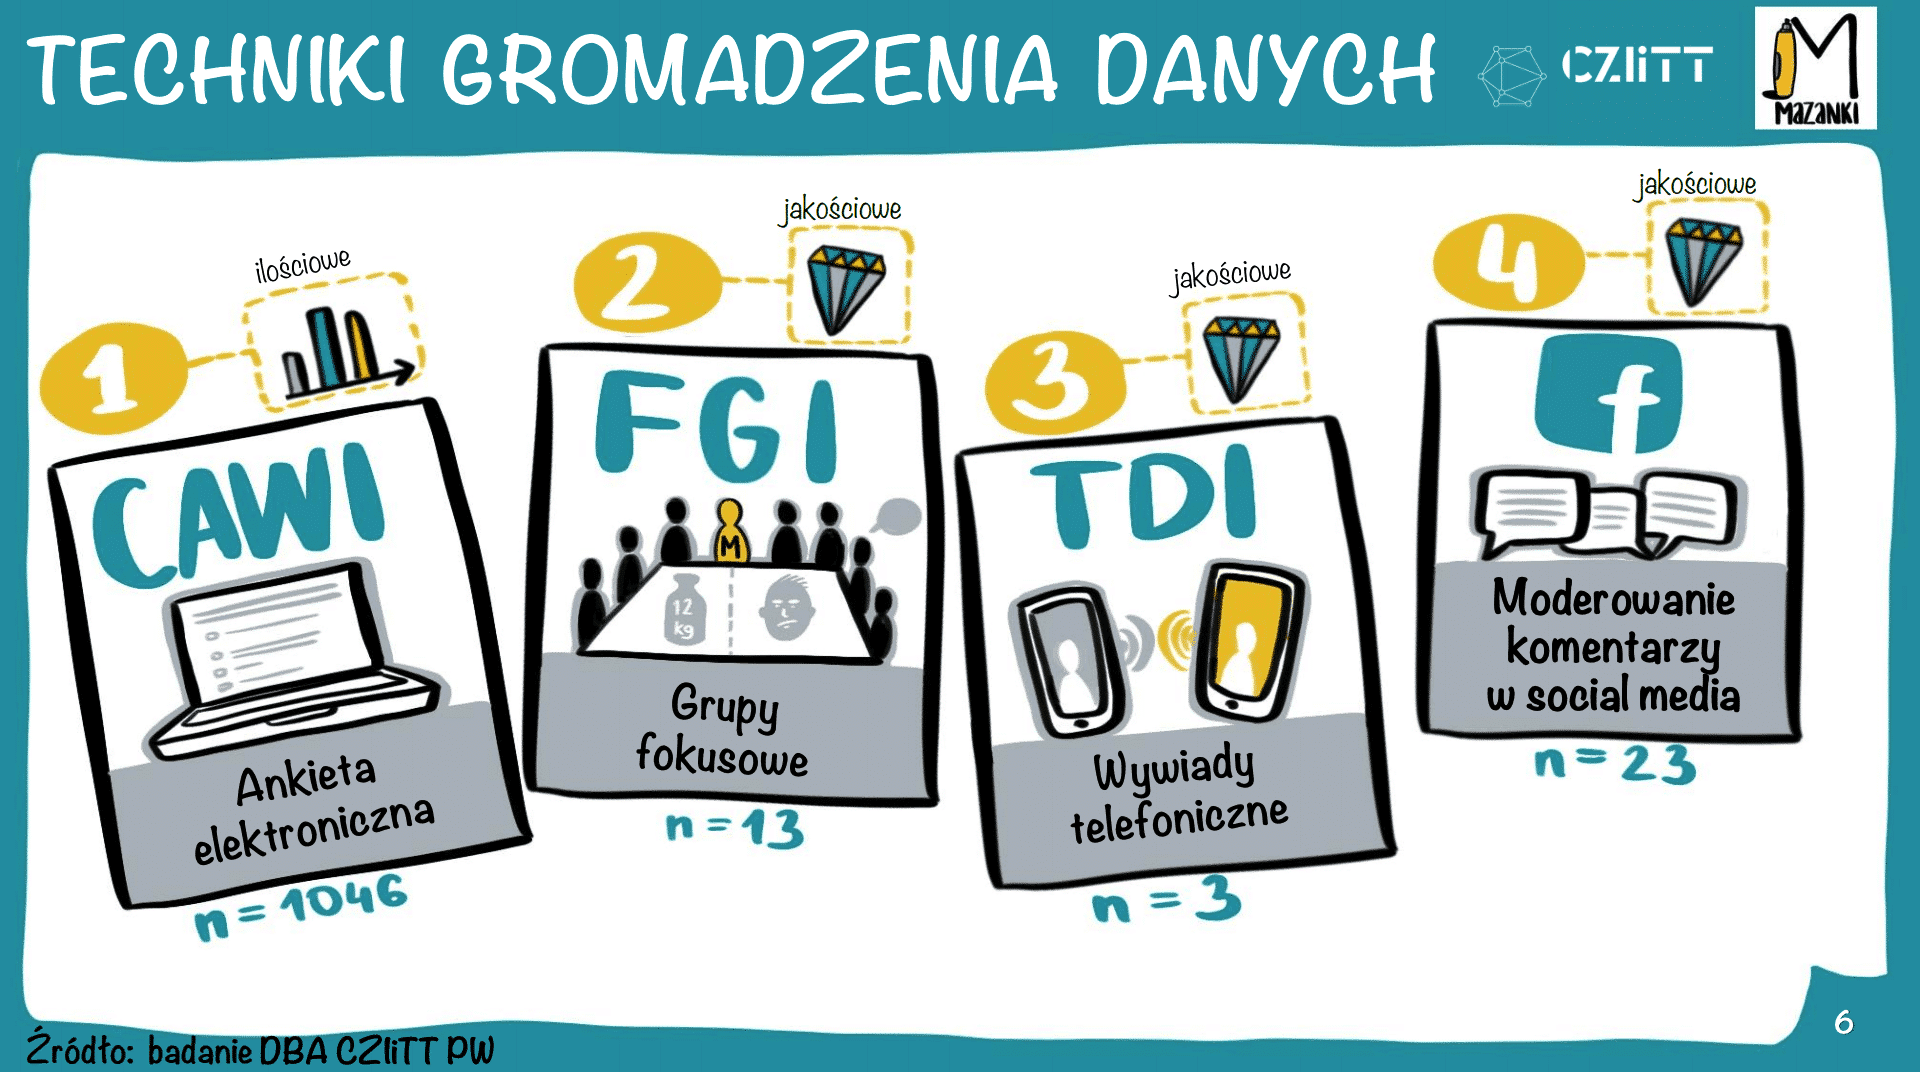
We understand perfectly. We’ve conducted studies in cooperation with the Centre for Innovation and Technology Transfer Management of Warsaw University of Technology. The original report consisted of over 60 pages and was super hard to read. So we translated it into the language of visuals, making it easier for us to tell about it at conferences.
A form like this has also encouraged viewers to give us their e-mail address in order to send them the whole material.
An example of a visualisation made for that report:

Contact us
We will advise you and answer all your questions.
And if you want to know more before you decide,
see our text and visual materials…
