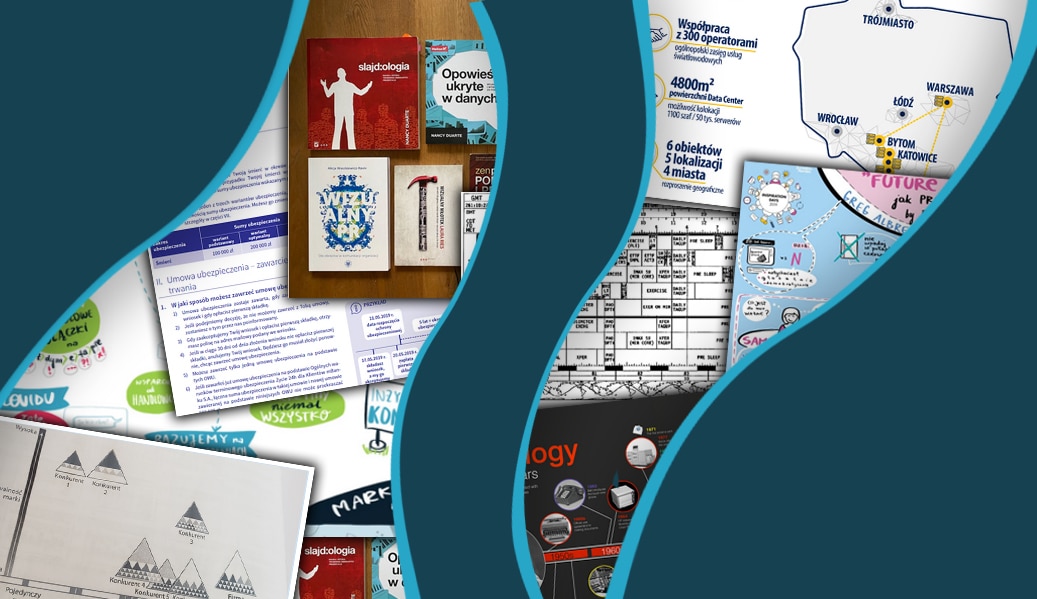
Jego przejawy obserwujemy, gdy widzimy na trasie znaki drogowe, oglądamy infografiki czy projektujemy nowe produkty na warsztatach Design Thinking.
Jednak jest to jedynie wierzchołek góry lodowej. Bo myślenie wizualne można z powodzeniem wykorzystać w medycynie, tworzeniu notatek czy – i o tym będzie dziś – w biznesie.
Dlaczego myślenie wizualne jest istotne w obecnych czasach
Wszyscy wiemy, że każdy jest dziś codziennie bombardowany ogromną ilością informacji. Nie mamy czasu przeczytać każdego maila, artykułu czy prezentacji, które trafiają w nasze ręce.
I nie tylko my. Nasi pracownicy czy klienci mają podobnie. Więc jeżeli przygotowujemy dla nich materiały dot. strategii lub produktu, których sami nie chcielibyśmy konsumować, to oni zapewne też się w trakcie wyłączą.
Myślenie wizualne pozwala skompresować przekazywane informacje w krótkie i lekkostrawne pigułki wiedzy. Tak, aby informacja, którą chcemy przekazać, trafiła do adresata, a nie została przez niego odrzucona już na wstępie.
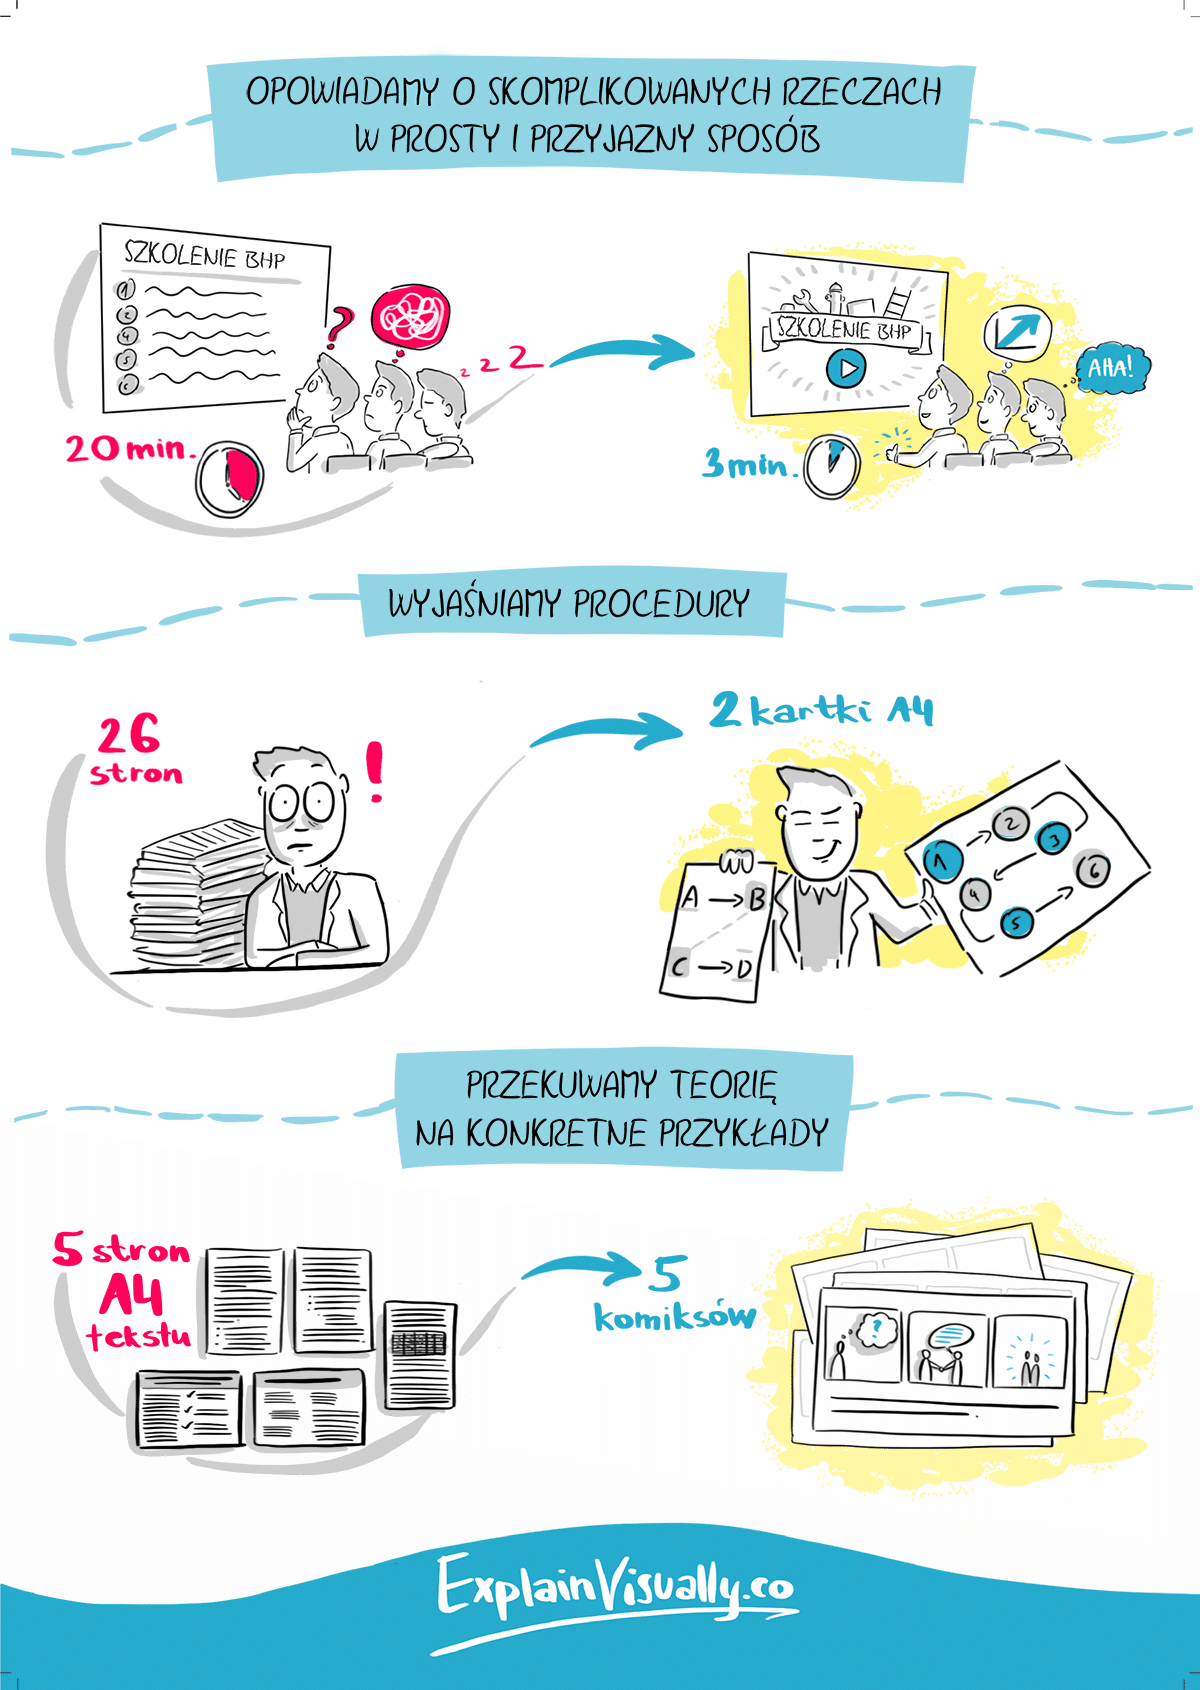
Przykład naszej ulotki prezentującej możliwości myślenia wizualnego
6 poziomów myślenia wizualnego
Myślenie wizualne można wdrażać na kilku poziomach. Najprostsze usprawnienia można zacząć robić praktycznie bez większego przygotowania. Te najbardziej złożone wymagają już dużej wiedzy oraz doświadczenia.
Poziom 1: Uzupełnienie tekstu o zdjęcia lub ikony
Jedną z najprostszych metod jest dodanie zdjęcia lub ikony, która uzupełnia przekaz. Dzięki temu odciążamy naszego rozmówcę i ułatwiamy mu połączenie kropek.
Oczywiście element wizualny musi zostać dobrany trafnie, bo inaczej nie spełni swojej roli.

W tym slajdzie z naszej oferty zdjęcie podsumowuje i uzupełnia to, co jest powiedziane za pomocą tekstu
Poziom 2: Przełożenie liczb na wykresy
To jest prawdopodobnie najpopularniejszy przejaw myślenia wizualnego. Liczby w tabelce “niewiele mówią” czytelnikom, ale gdy przełożymy je na wykres, nagle wnioski nasuwają się same.
Liczba użytkowników TikToka w tabeli:

Liczba użytkowników TikToka na wykresie:
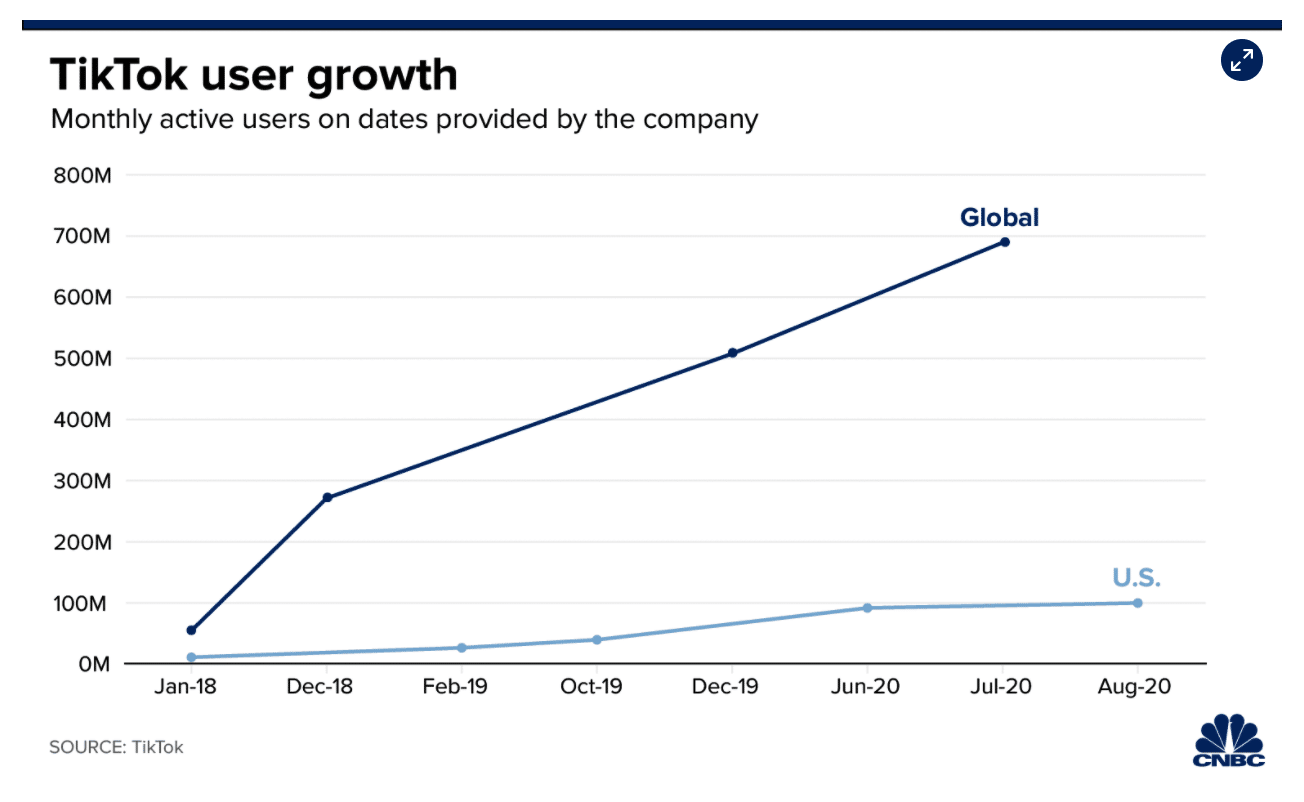
Wykres dużo łatwiej zrozumieć niż samą listę liczb
Poziom 3: Wizualne uporządkowanie tekstu
Jeżeli mówisz o czymś złożonym jak np. strategia biznesowa czy marketingowa, możesz zbudować mapę myśli, która uporządkuje cały temat.
My np. taką zrobiliśmy do naszego tekstu o wsparciu sprzedaży.
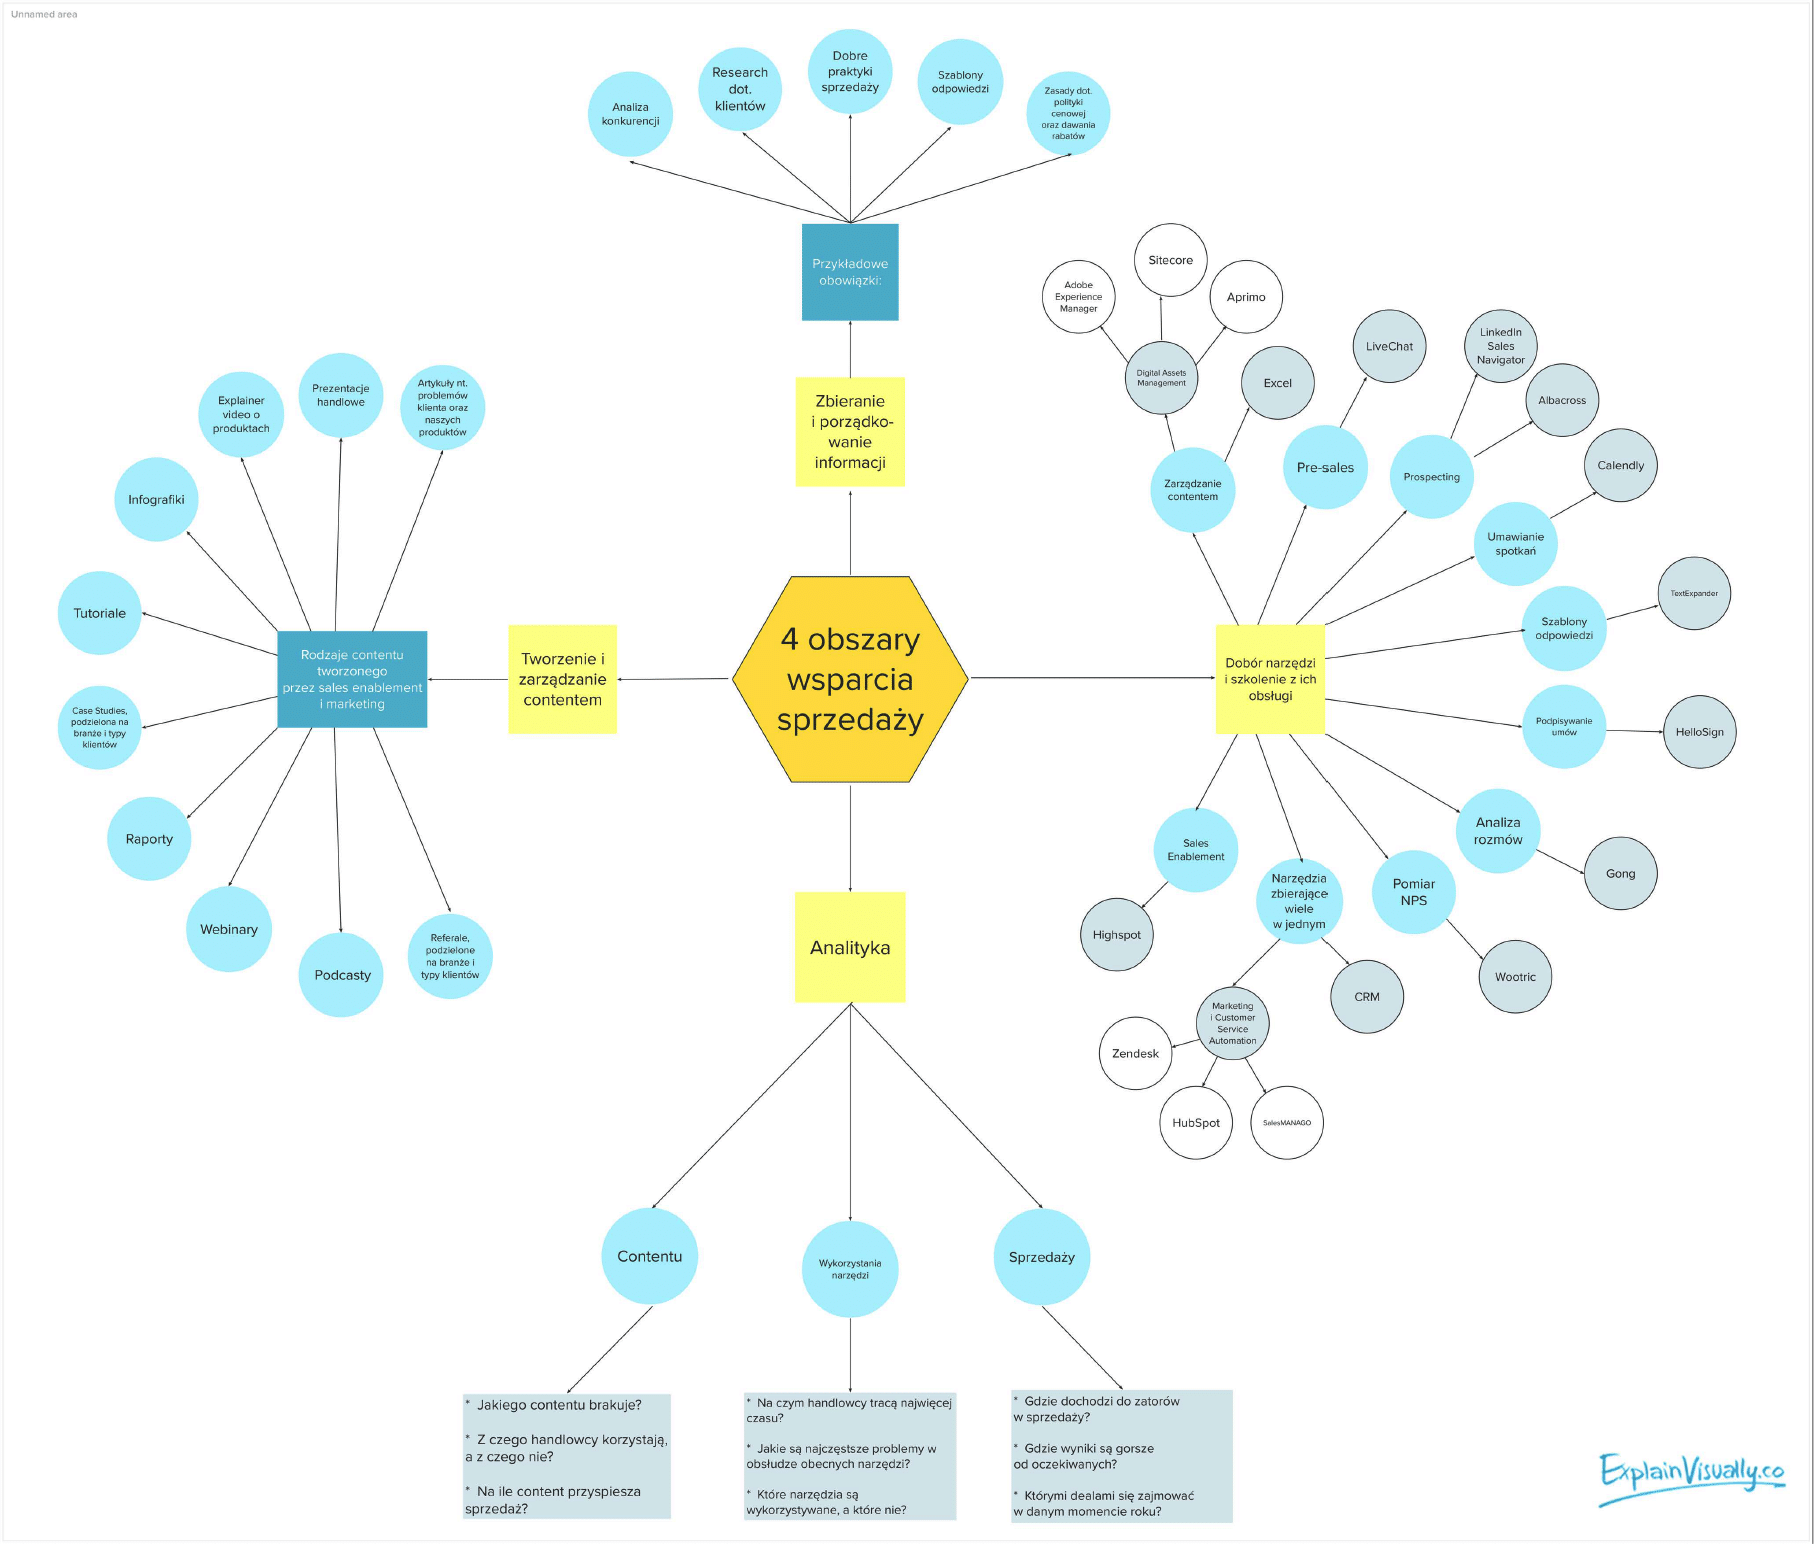
Prosta wizualnie mindmapa pomaga uporządkować złożony temat, jakim jest wsparcie sprzedaży
Poziom 4: Skompresowanie tekstu do jednej wizualizacji
To zadanie jest sporo trudniejsze niż poprzednie.
O ile w Poziomie 3 po prostu wizualizowaliśmy jakiś temat, to tutaj musimy również podjąć decyzję o usunięciu zbędnych elementów, żeby zmieścić całość na jednej wizualizacji.
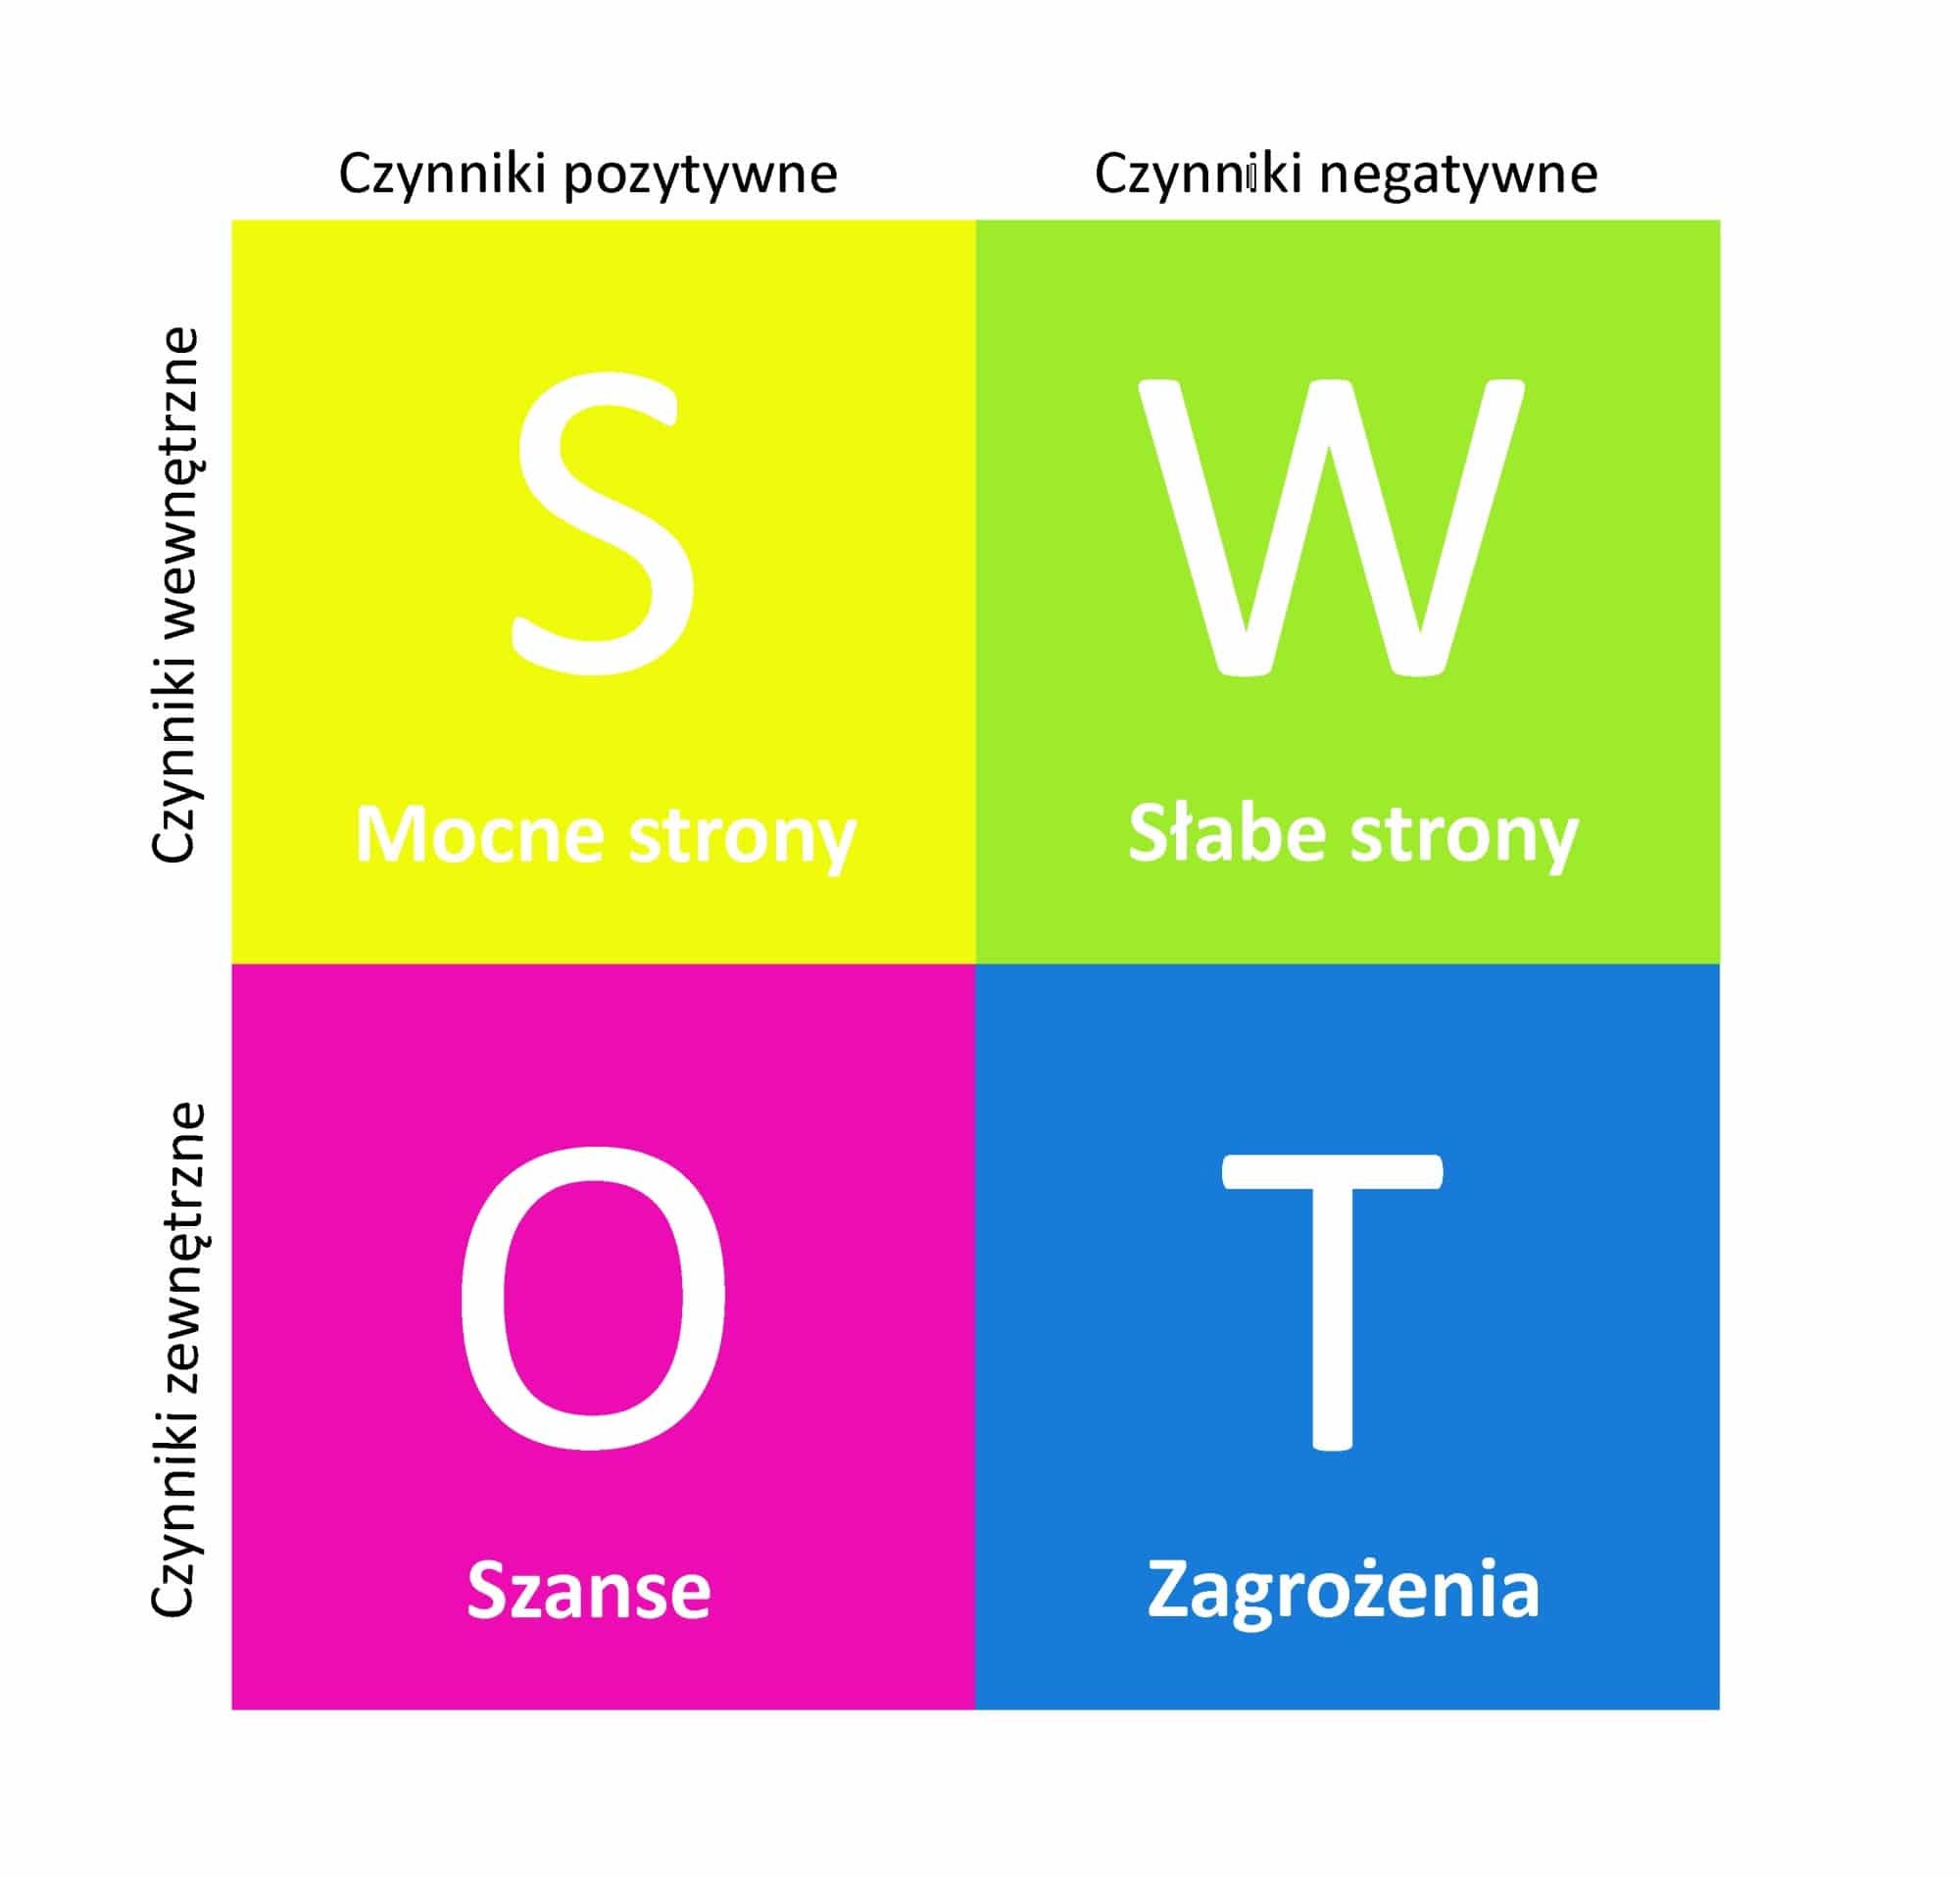
Przykładem takiej kompresji jest analiza SWOT, czyli prosty podział informacji strategicznych, który pomaga szybko złapać istotę przewag i słabości danej firmy
Poziom 5: Przełożenie abstrakcyjnych pojęć na wizualizacje
Ten poziom wymaga zwykle jeszcze większej wiedzy. Wynika to z tego, że całość oblekamy w zwięzłą wizualizację, która musi zostać stworzona zgodnie z zasadami designu.
Poziom 6: Przełożenie informacji na rozbudowane wizualizacje danych
Ten poziom jest połączeniem wszystkich poprzednich.
W takiej wizualizacji:
– dopasowujemy odpowiednie ikony,
– obrazujemy dane za pomocą adekwatnych wykresów,
– wyodrębniamy najważniejsze kategorie,
– usuwamy zbędne informacje,
– i podsumowujemy całość w jednej grafice.

Ta wizualizacja została stworzona w celach rozrywkowych, ale jest przykładem świetnej wizualizacji danych i informacji. Źródło: link
Skoro znamy już poziomy myślenia wizualnego, to przejdźmy do konkretnych przykładów biznesowych.
Jak myślenie wizualne wygląda w biznesie: przykłady
Biznes pełen jest abstrakcyjnych pojęć.
“Strategia”, “cloud” czy “zorientowanie na klienta” to na tyle szerokie pojęcia, że często stają się pustymi frazesami. Myślenie wizualne pozwala je osadzić na konkretnych przykładach, ułatwiając odbiorcom zrozumienie “Co autor miał na myśli?”.
Poniżej kilka przykładów zastosowania takich metod.
Infografika
Komunikacja wewnętrzna
Wyobraź sobie, że chcesz opowiedzieć pracownikom o strategii lub wartościach firmy. Jak uniknąć pustych frazesów? Możesz ubrać przekaz w trafne infografiki.

Przykład jak pomagaliśmy osadzić abstrakcyjne wartości firmy farmaceutycznej na konkretnych przykładach
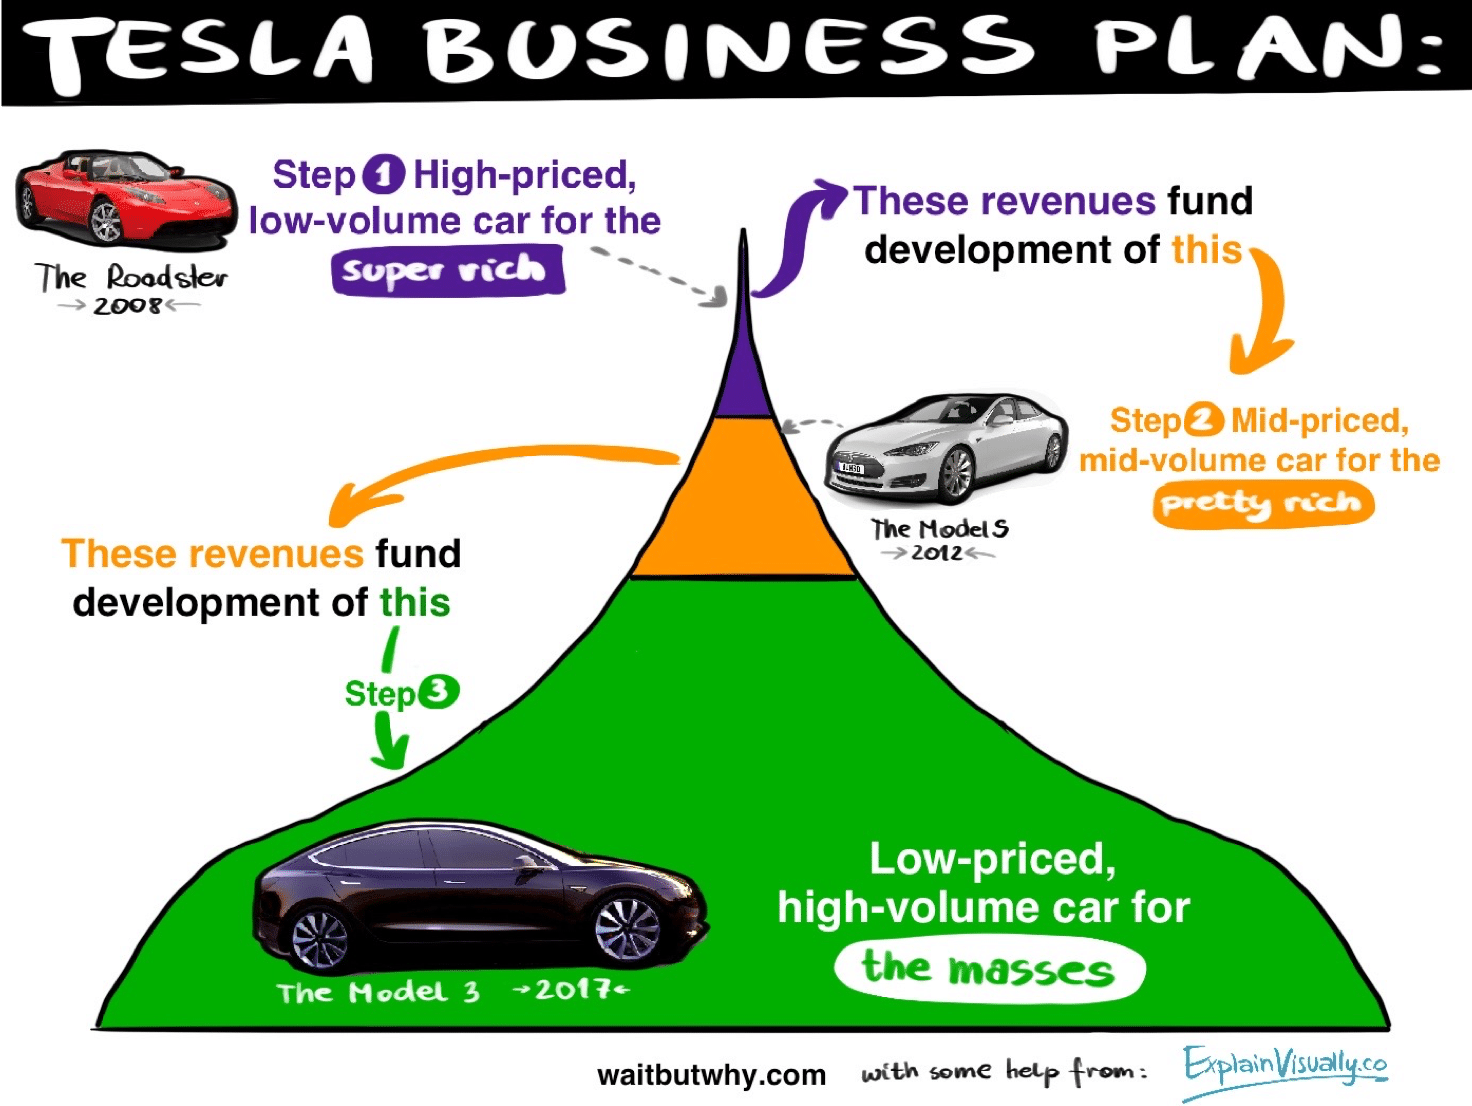
Nasz remix infografiki opowiadającej o strategii biznesowej Tesli
Komunikacja zewnętrzna
Chcesz, żeby klienci zrozumieli zalety Twojej oferty w parę sekund? To im to pokaż.
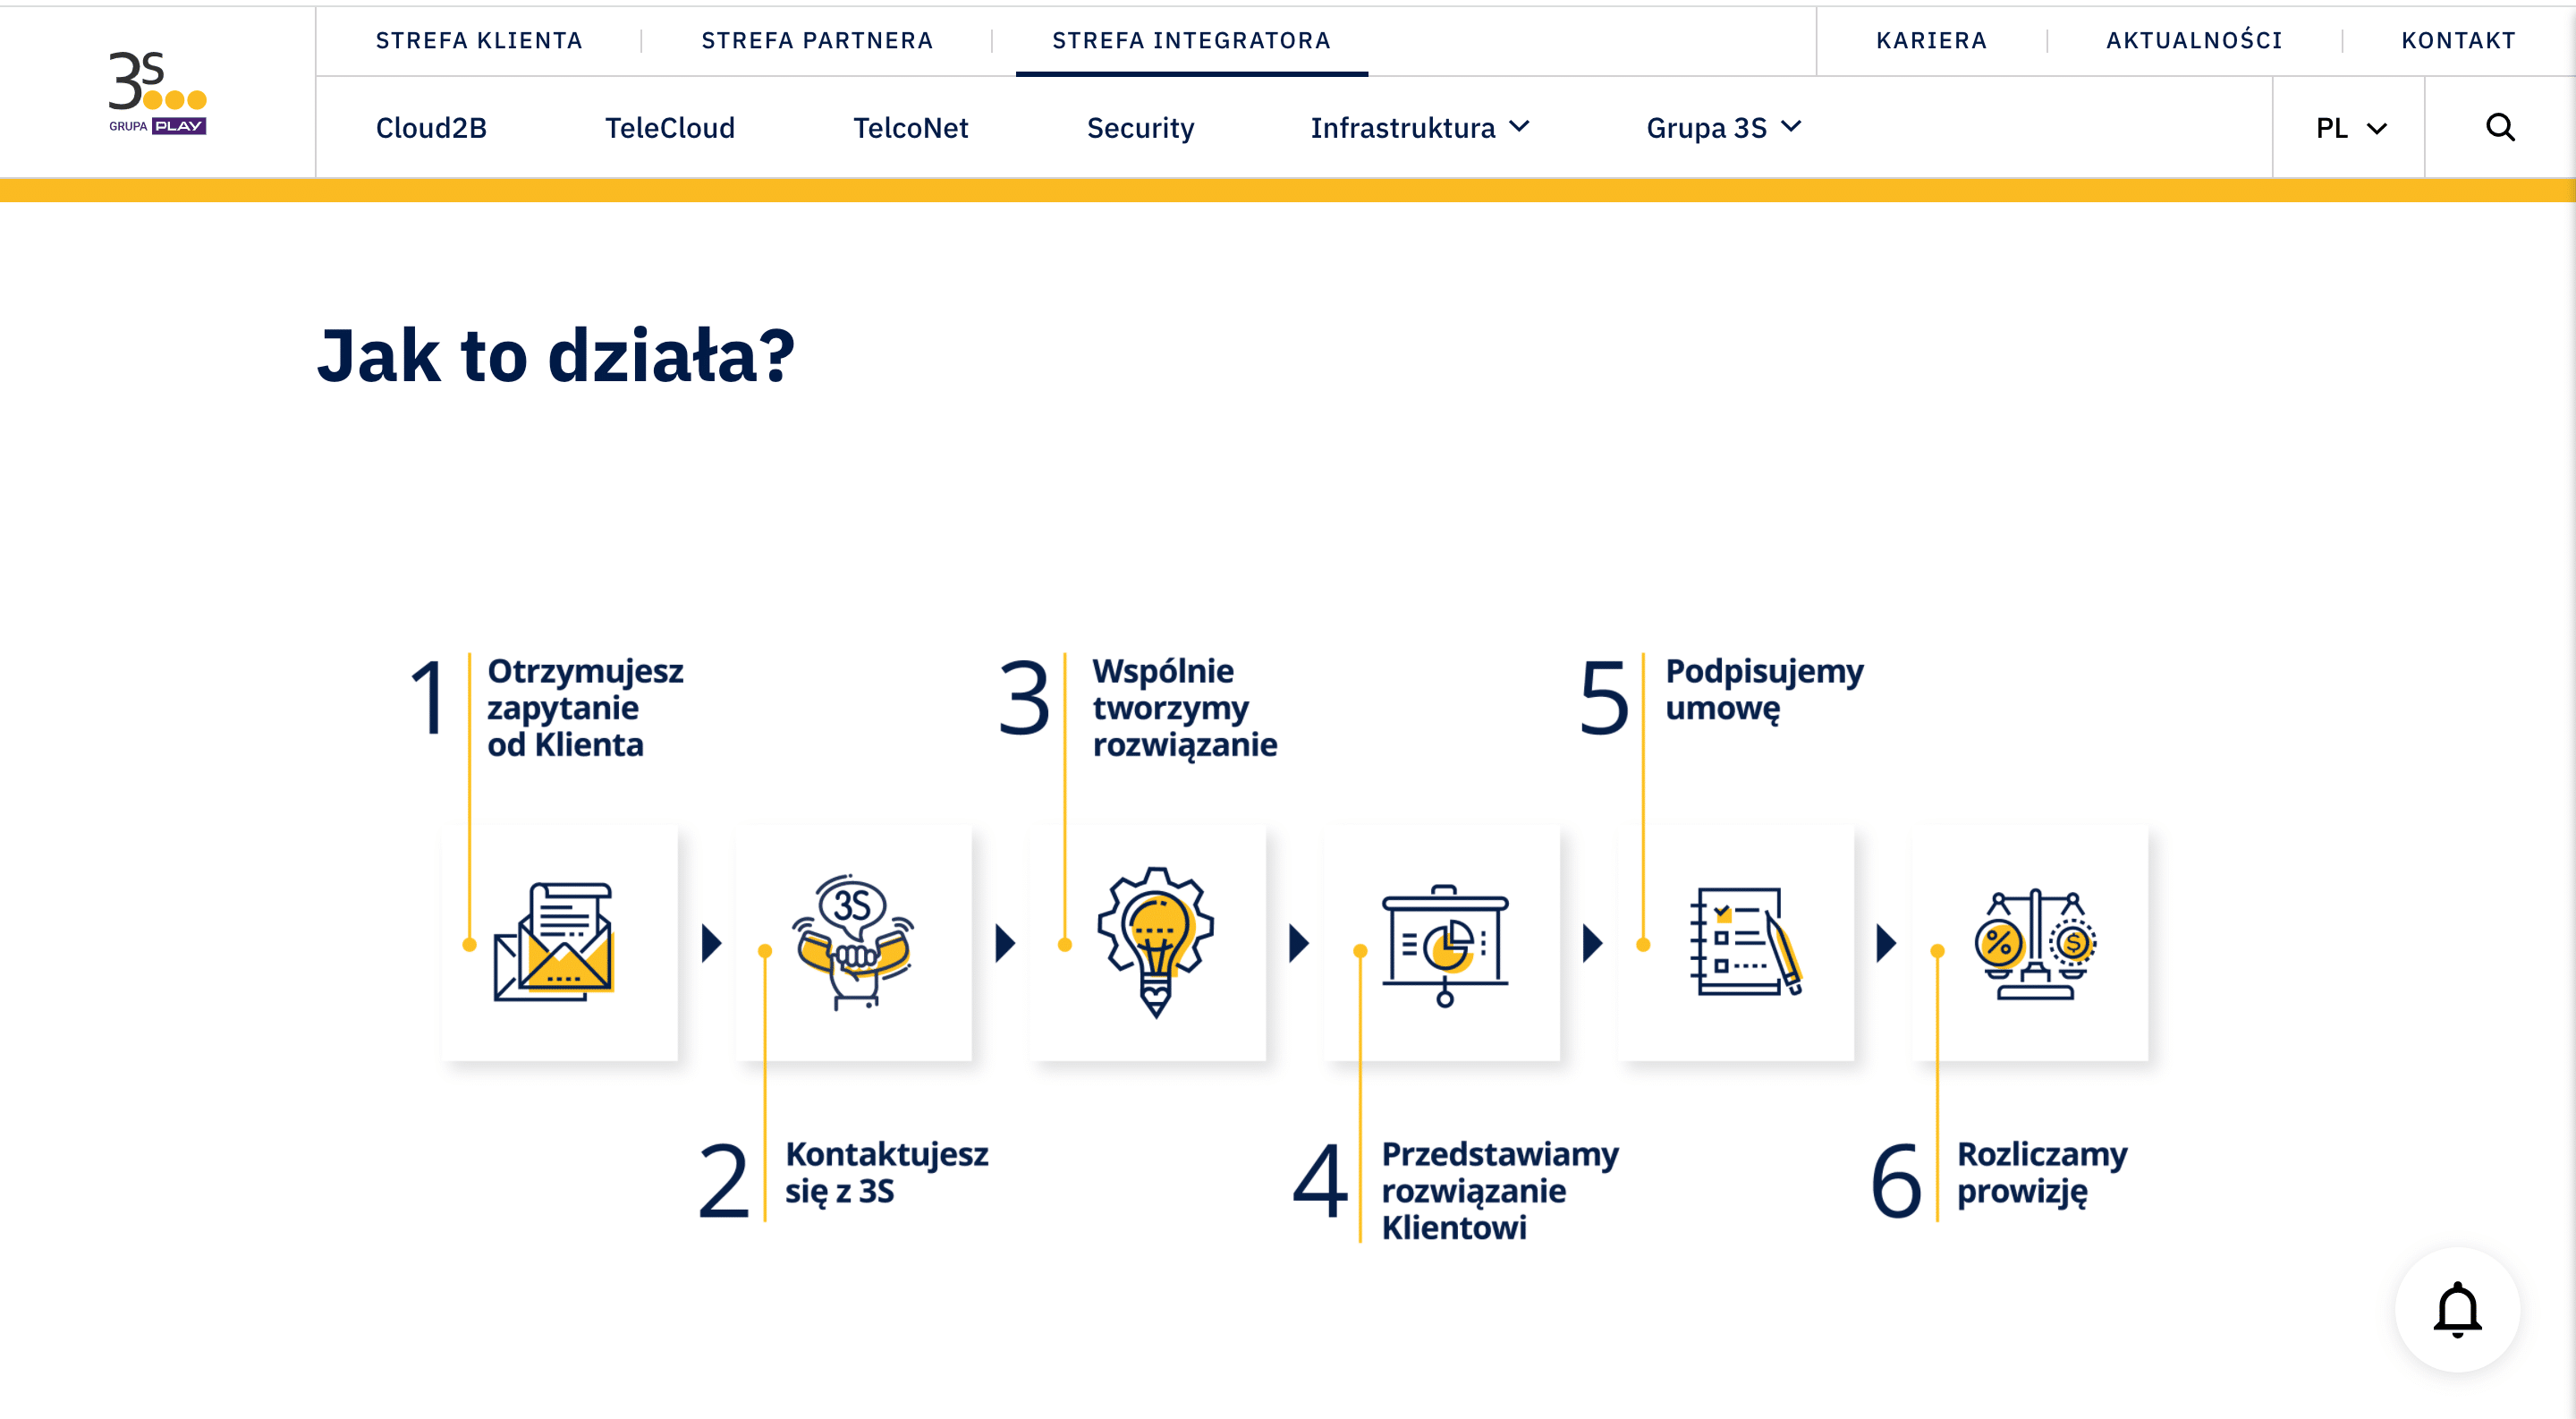
Fragment strony dla integratorów 3S, którą dla nich projektowaliśmy
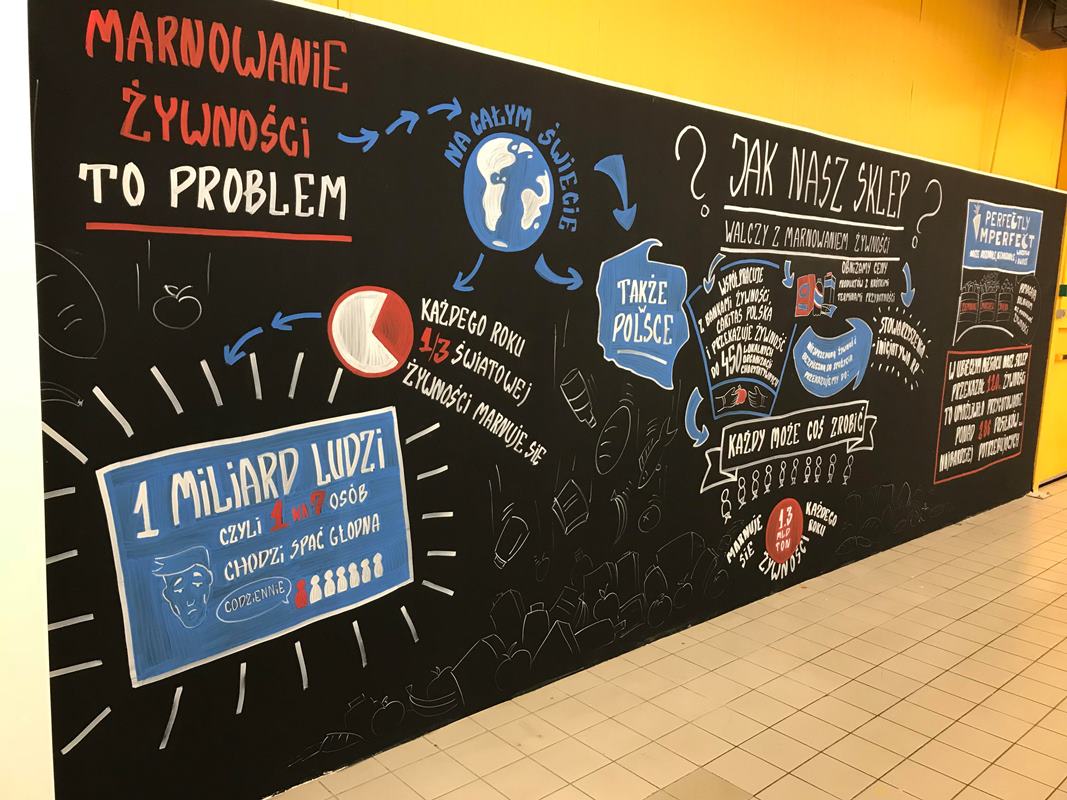
Przykład ręcznie robionej infografiki, którą edukowaliśmy klientów TESCO nt. działań firmy na rzecz niemarnowania żywności

Infografika edukacyjna dla lekarzy
Animacje
Komunikacja wewnętrzna
Jeżeli masz możliwość wyświetlenia video, to możesz również dotrzeć do swoich pracowników animacją, tak jak zrobiła to Coca-Cola, omawiając swoją strategię contentową.
Omówienie strategii contentowej Coca-Coli
Komunikacja zewnętrzna
Możesz też opowiedzieć klientom o produkcie w formie krótkiej historii. Tak jak zrobiliśmy to dla SHARPa.
Explainer video SHARP
Slajdy
Wciąż wiele firm komunikuje się za pomocą slajdów. Problem polega niestety na tym, że wiele z nich to przykra w odbiorze ściana tekstu. I zamiast mieścić się w 10 czy 15 slajdach, prezentacje ciągną się na dziesiątki, a czasem i setki plansz.
Myślenie wizualne pomaga w kompresji informacji, zatem pomaga też w redukcji liczby slajdów.
Komunikacja wewnętrzna

Slajd który był częścią prezentacji dot. digitalizacji, wygłaszanej przez prezesa jednego z polskich banków:
Komunikacja zewnętrzna
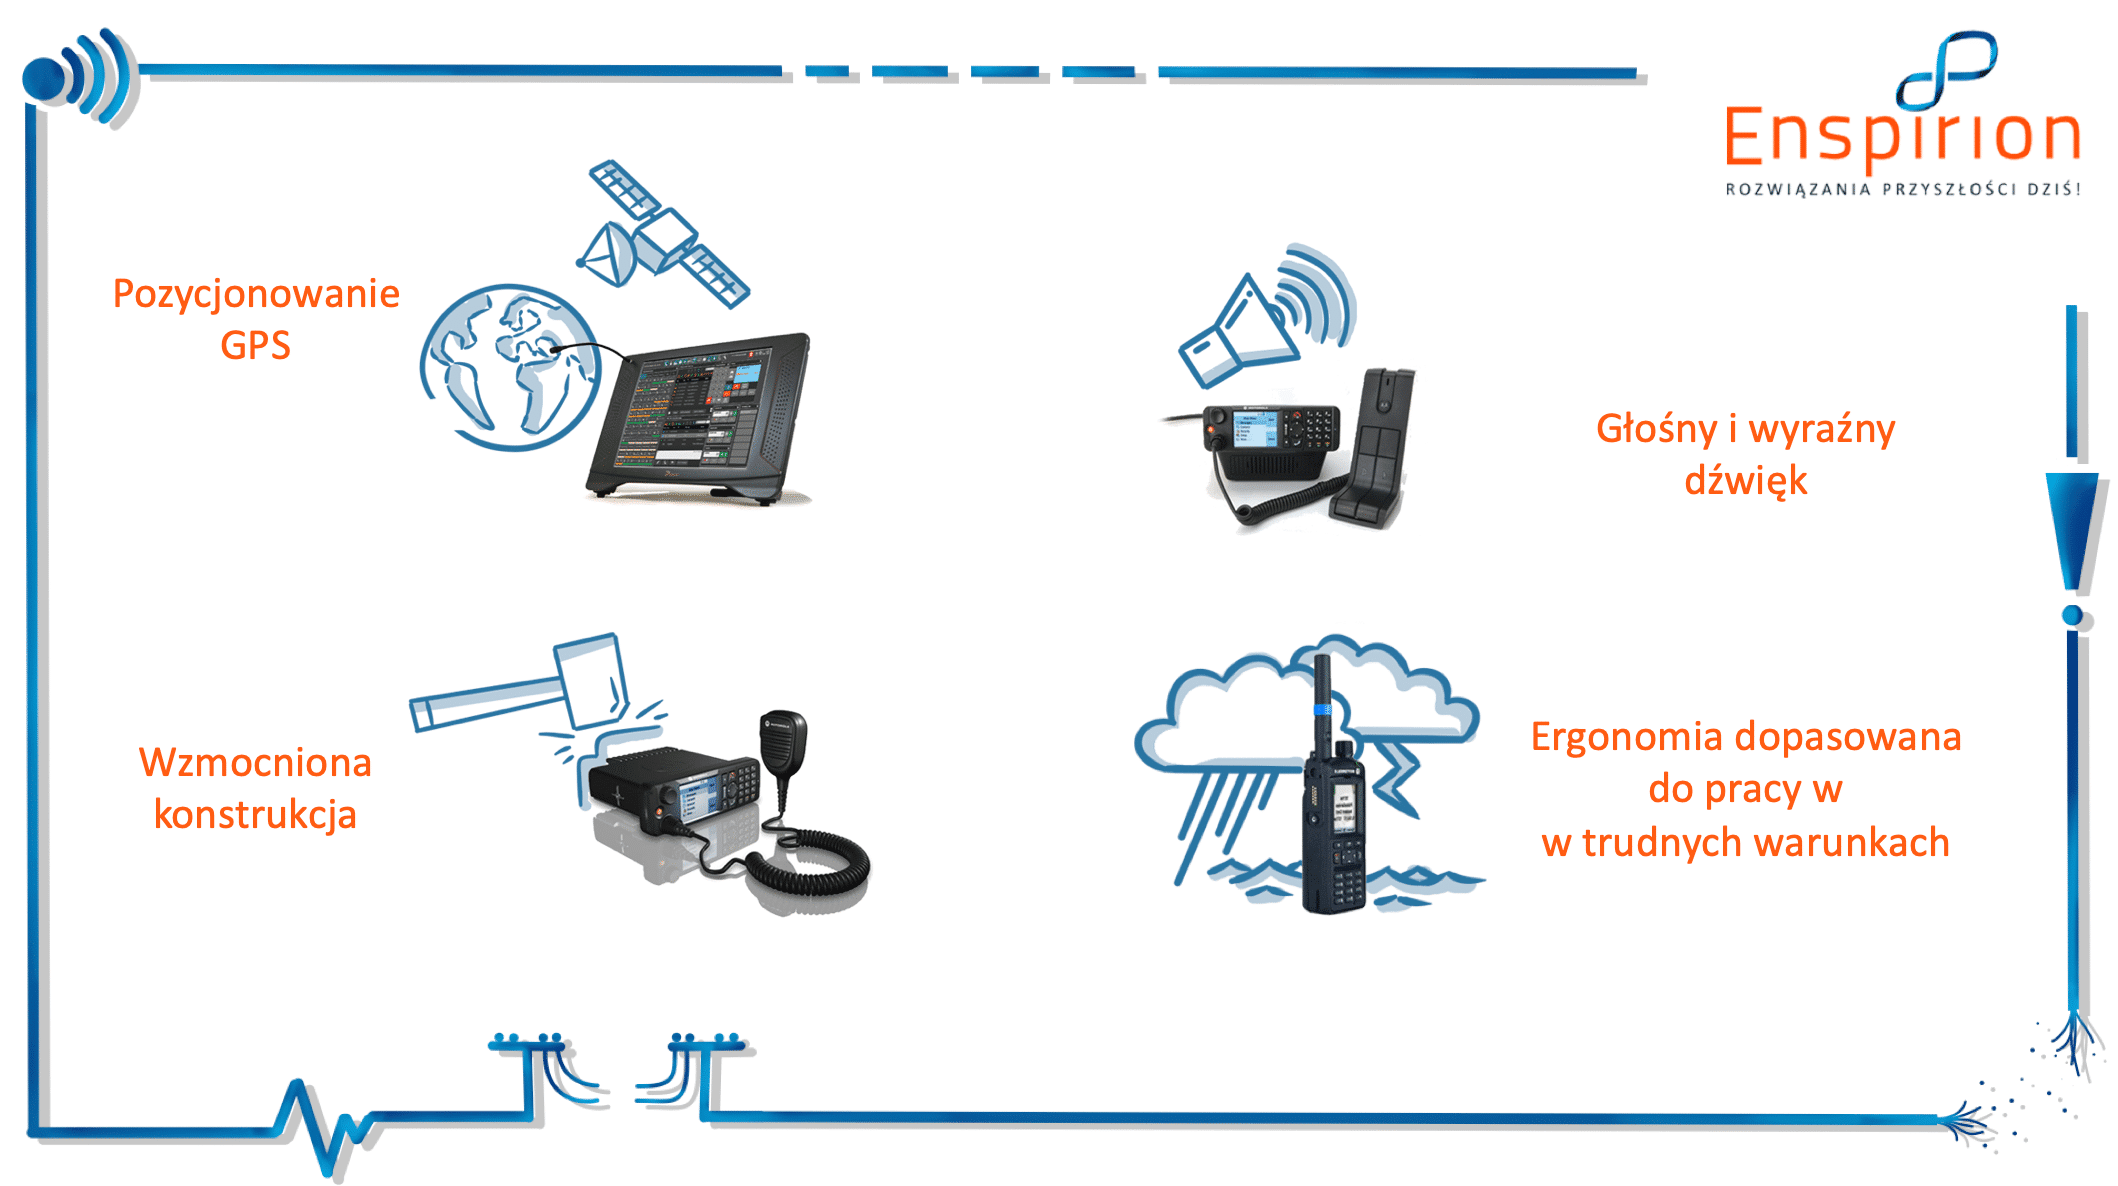
Slajd, który w obrazowy sposób pokazuje cechy produktów firmy Enspirion
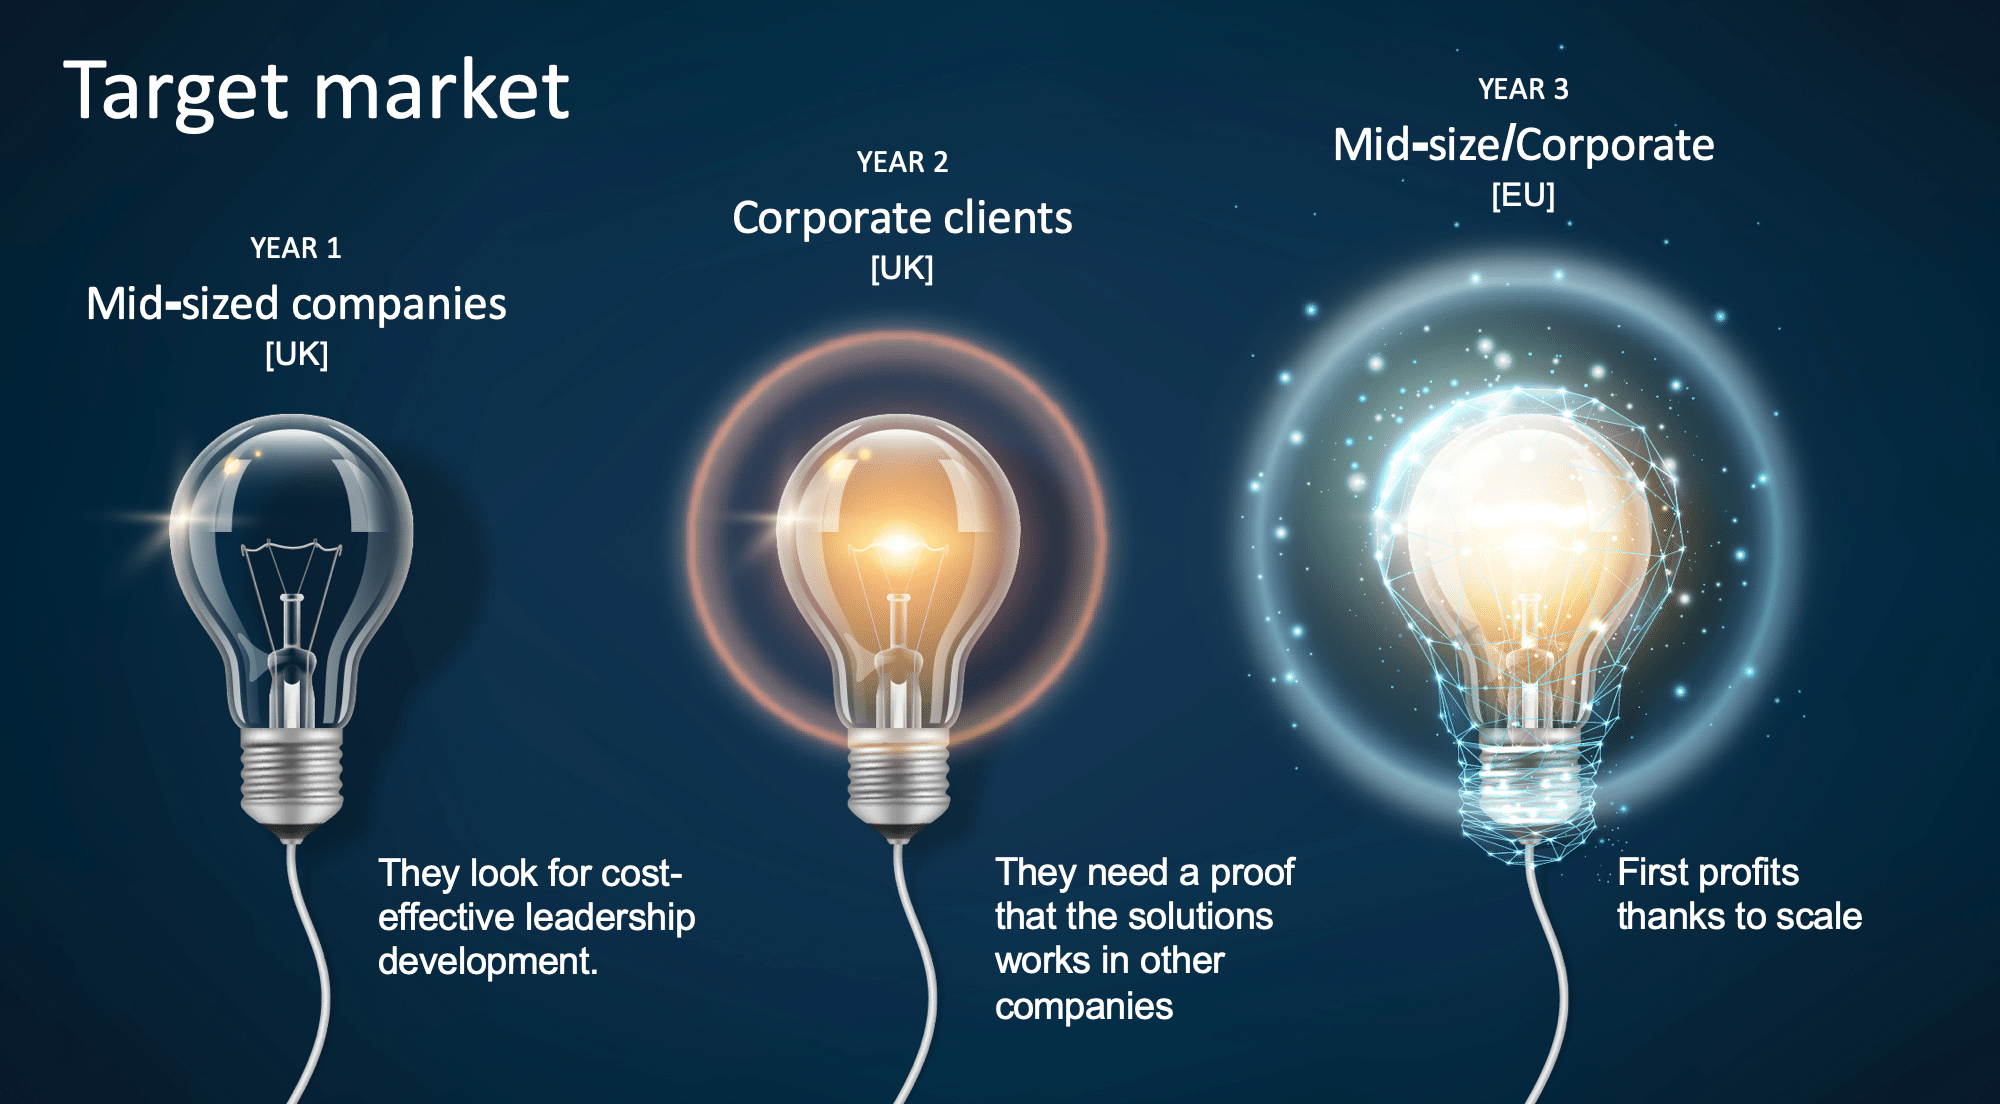
Slajd, który opowiada inwestorom nt. planowanego rozwoju rynku
Komiks:
Czasem abstrakcyjny przekaz najlepiej wyrazić prostą, komiksową historią.
Komunikacja wewnętrzna
Abstrakcyjne zasady można przenieść na historie obrazujące tzw. DOs and DONTs, czyli co powinniśmy robić, a czego nie.

Mondelez stworzyło komiksy do edukacji swoich handlowców nt. merchandisingu
Komunikacja zewnętrzna
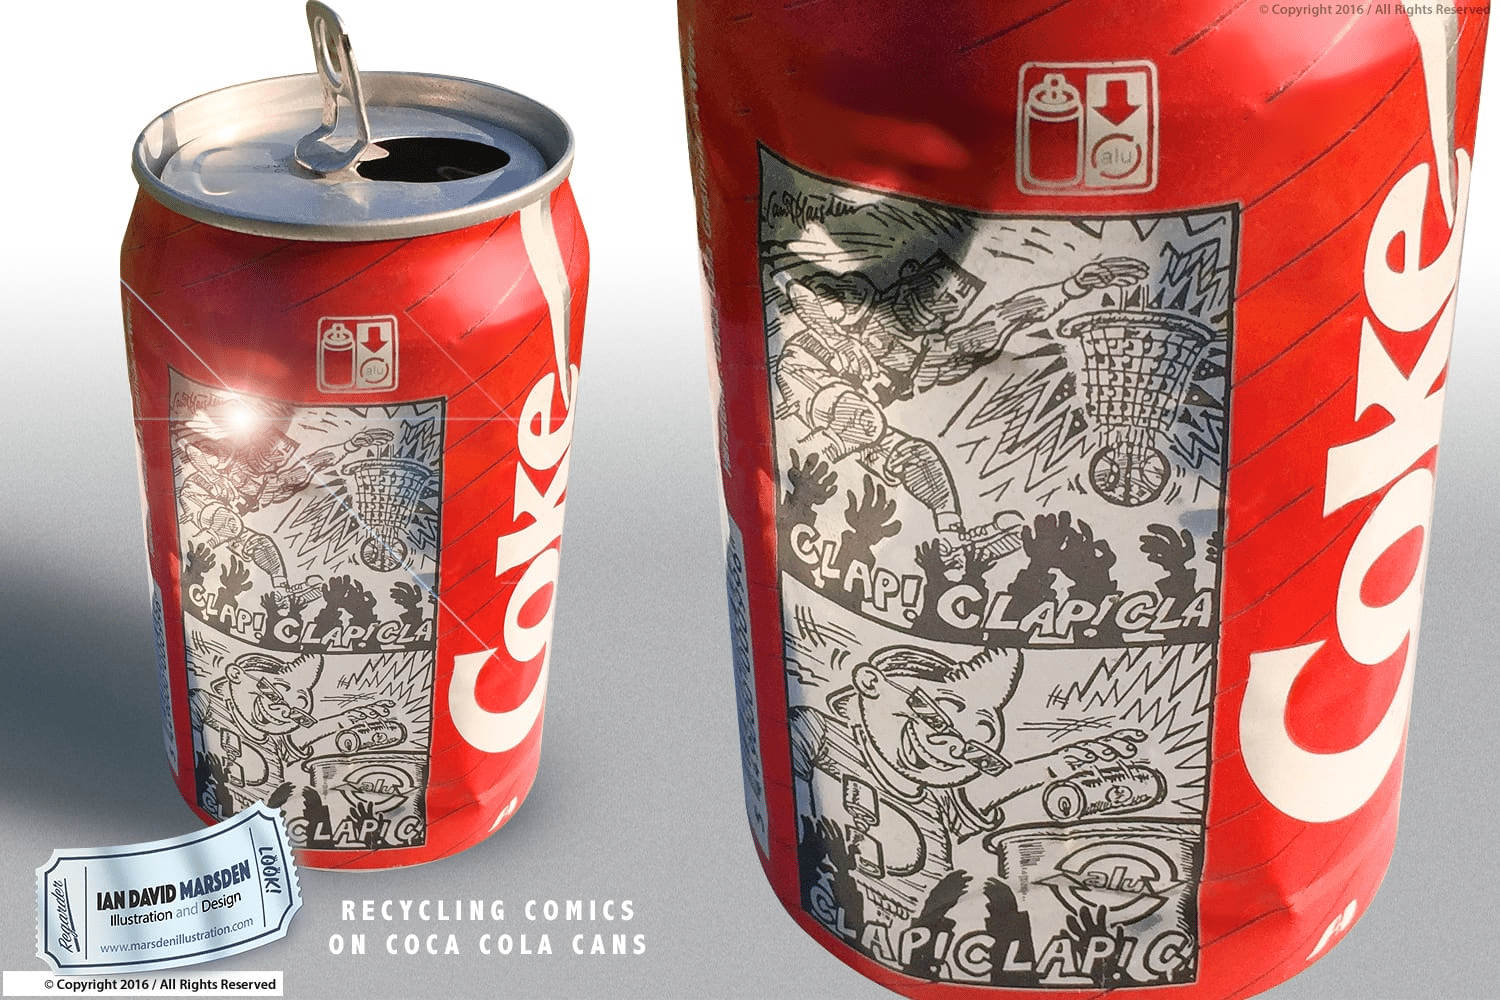
Komiks Coca-Coli inspirujący klientów do recyklingu:
Graphic Recording:
Graphic Recording to notatki wizualne, realizowane w czasie rzeczywistym. Pomagają porządkować spotkania, nie zapomnieć o poruszanych wątkach oraz służą jako przypomnienie i podsumowanie materiału. Więcej na ten temat pisaliśmy w tekście Czym jest Graphic Recording i Graphic Facilitation.
Komunikacja wewnętrzna
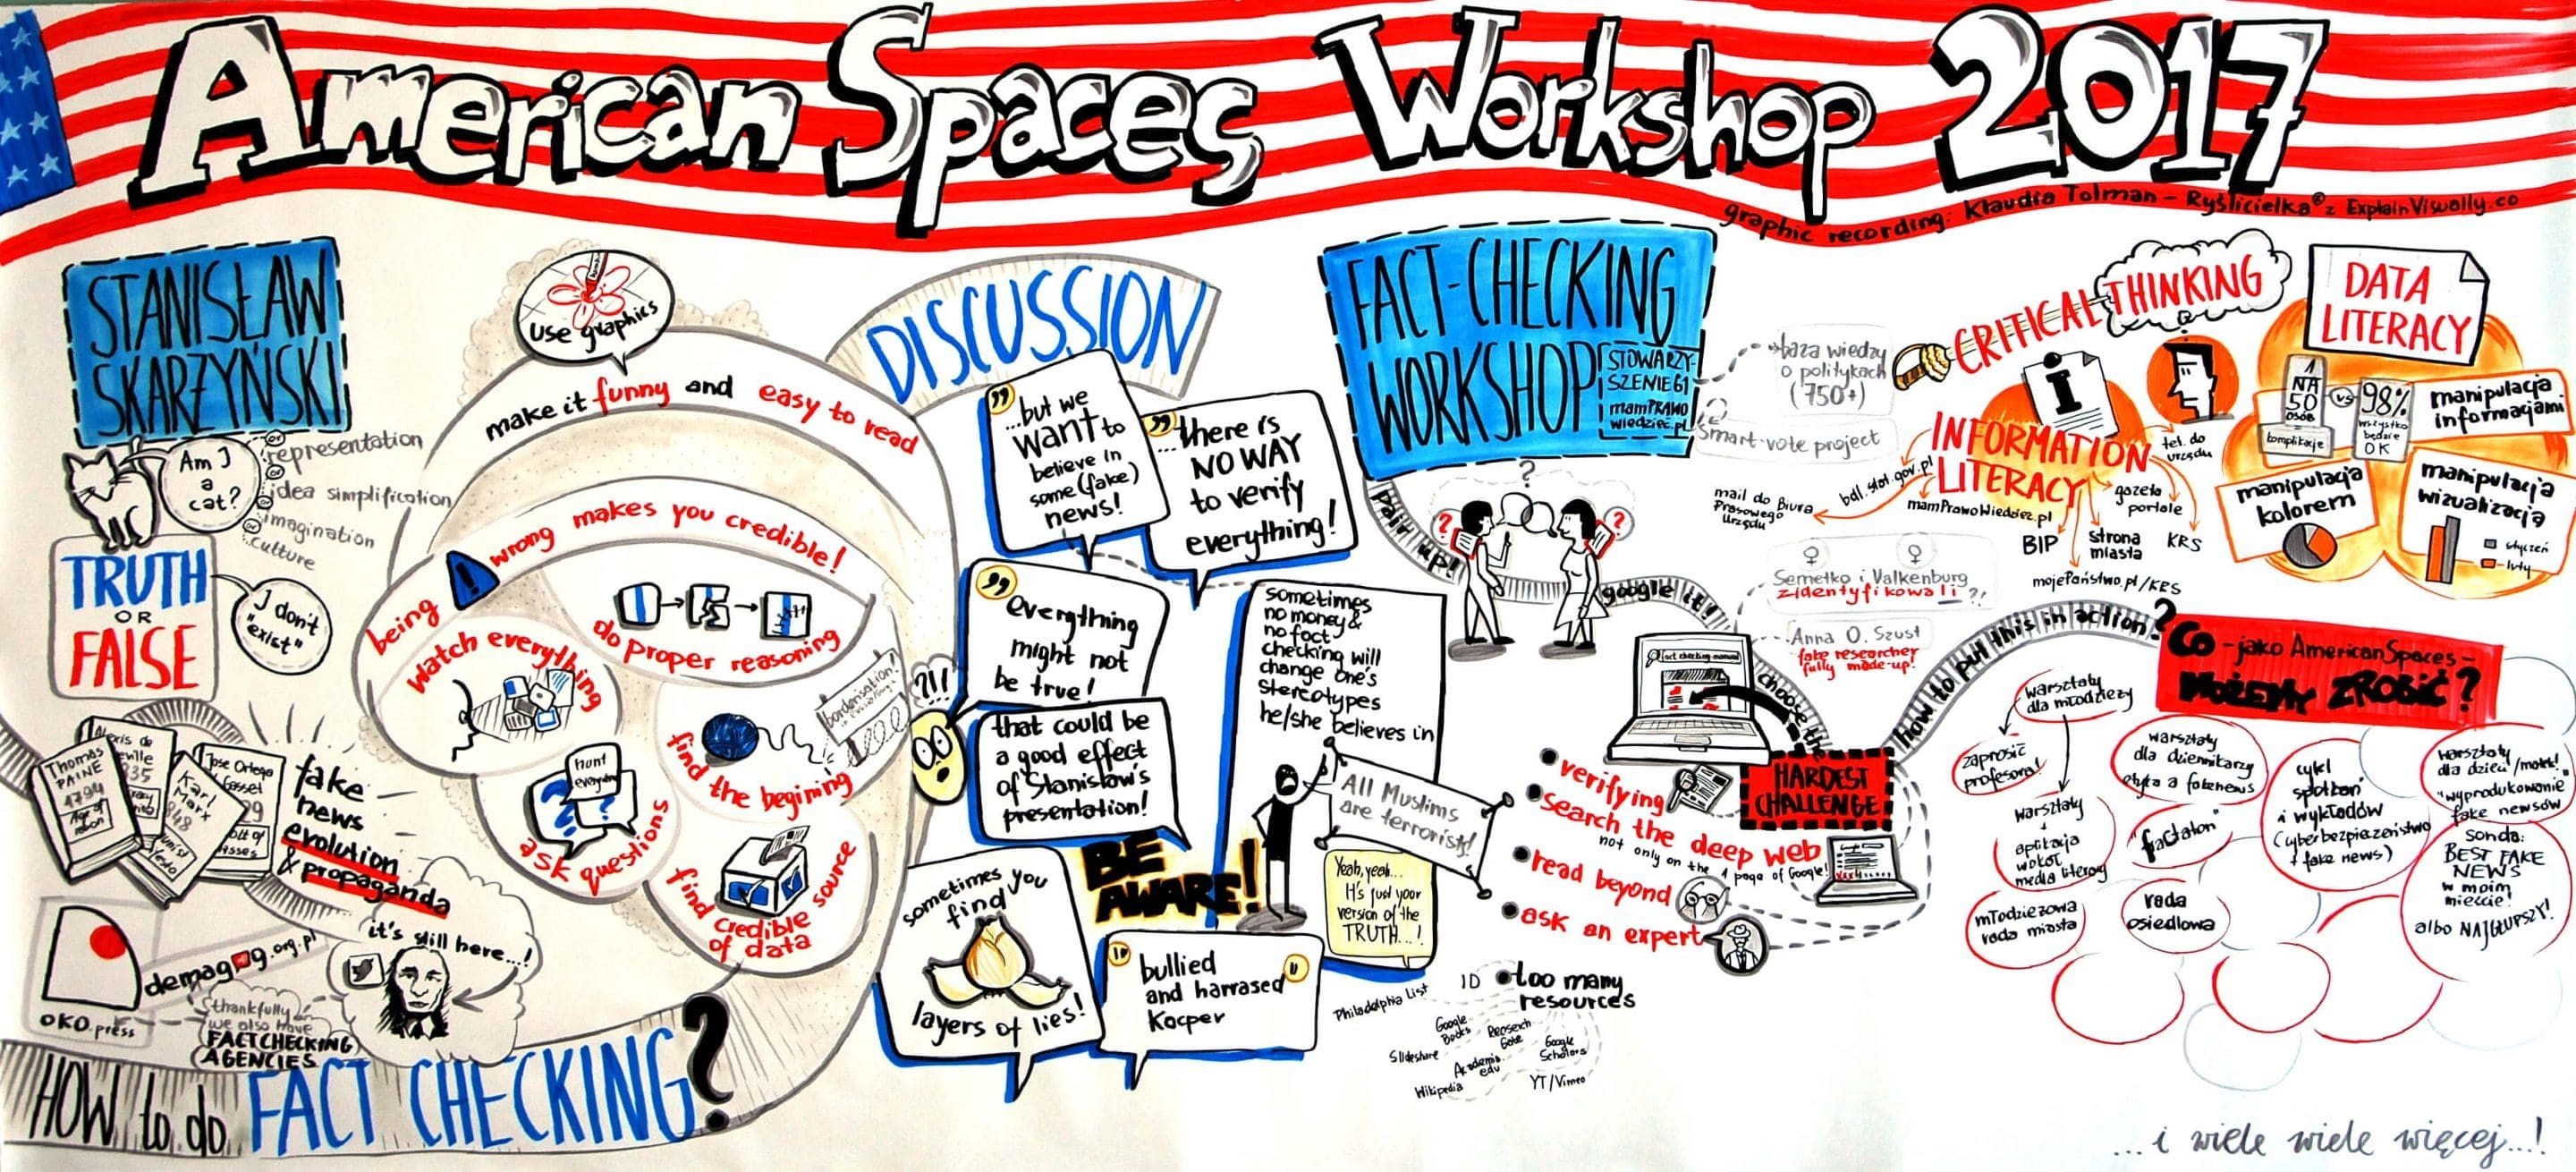
Notatka z warsztatu dla Ambasady USA w Warszawie nt. koncepcji American Spaces
Komunikacja zewnętrzna
Za pomocą graphic recordingu można również podsumowywać wystąpienia na konferencji oraz podcasty.

Podsumowanie wystąpienia na konferencji Mazovia Circular Congress
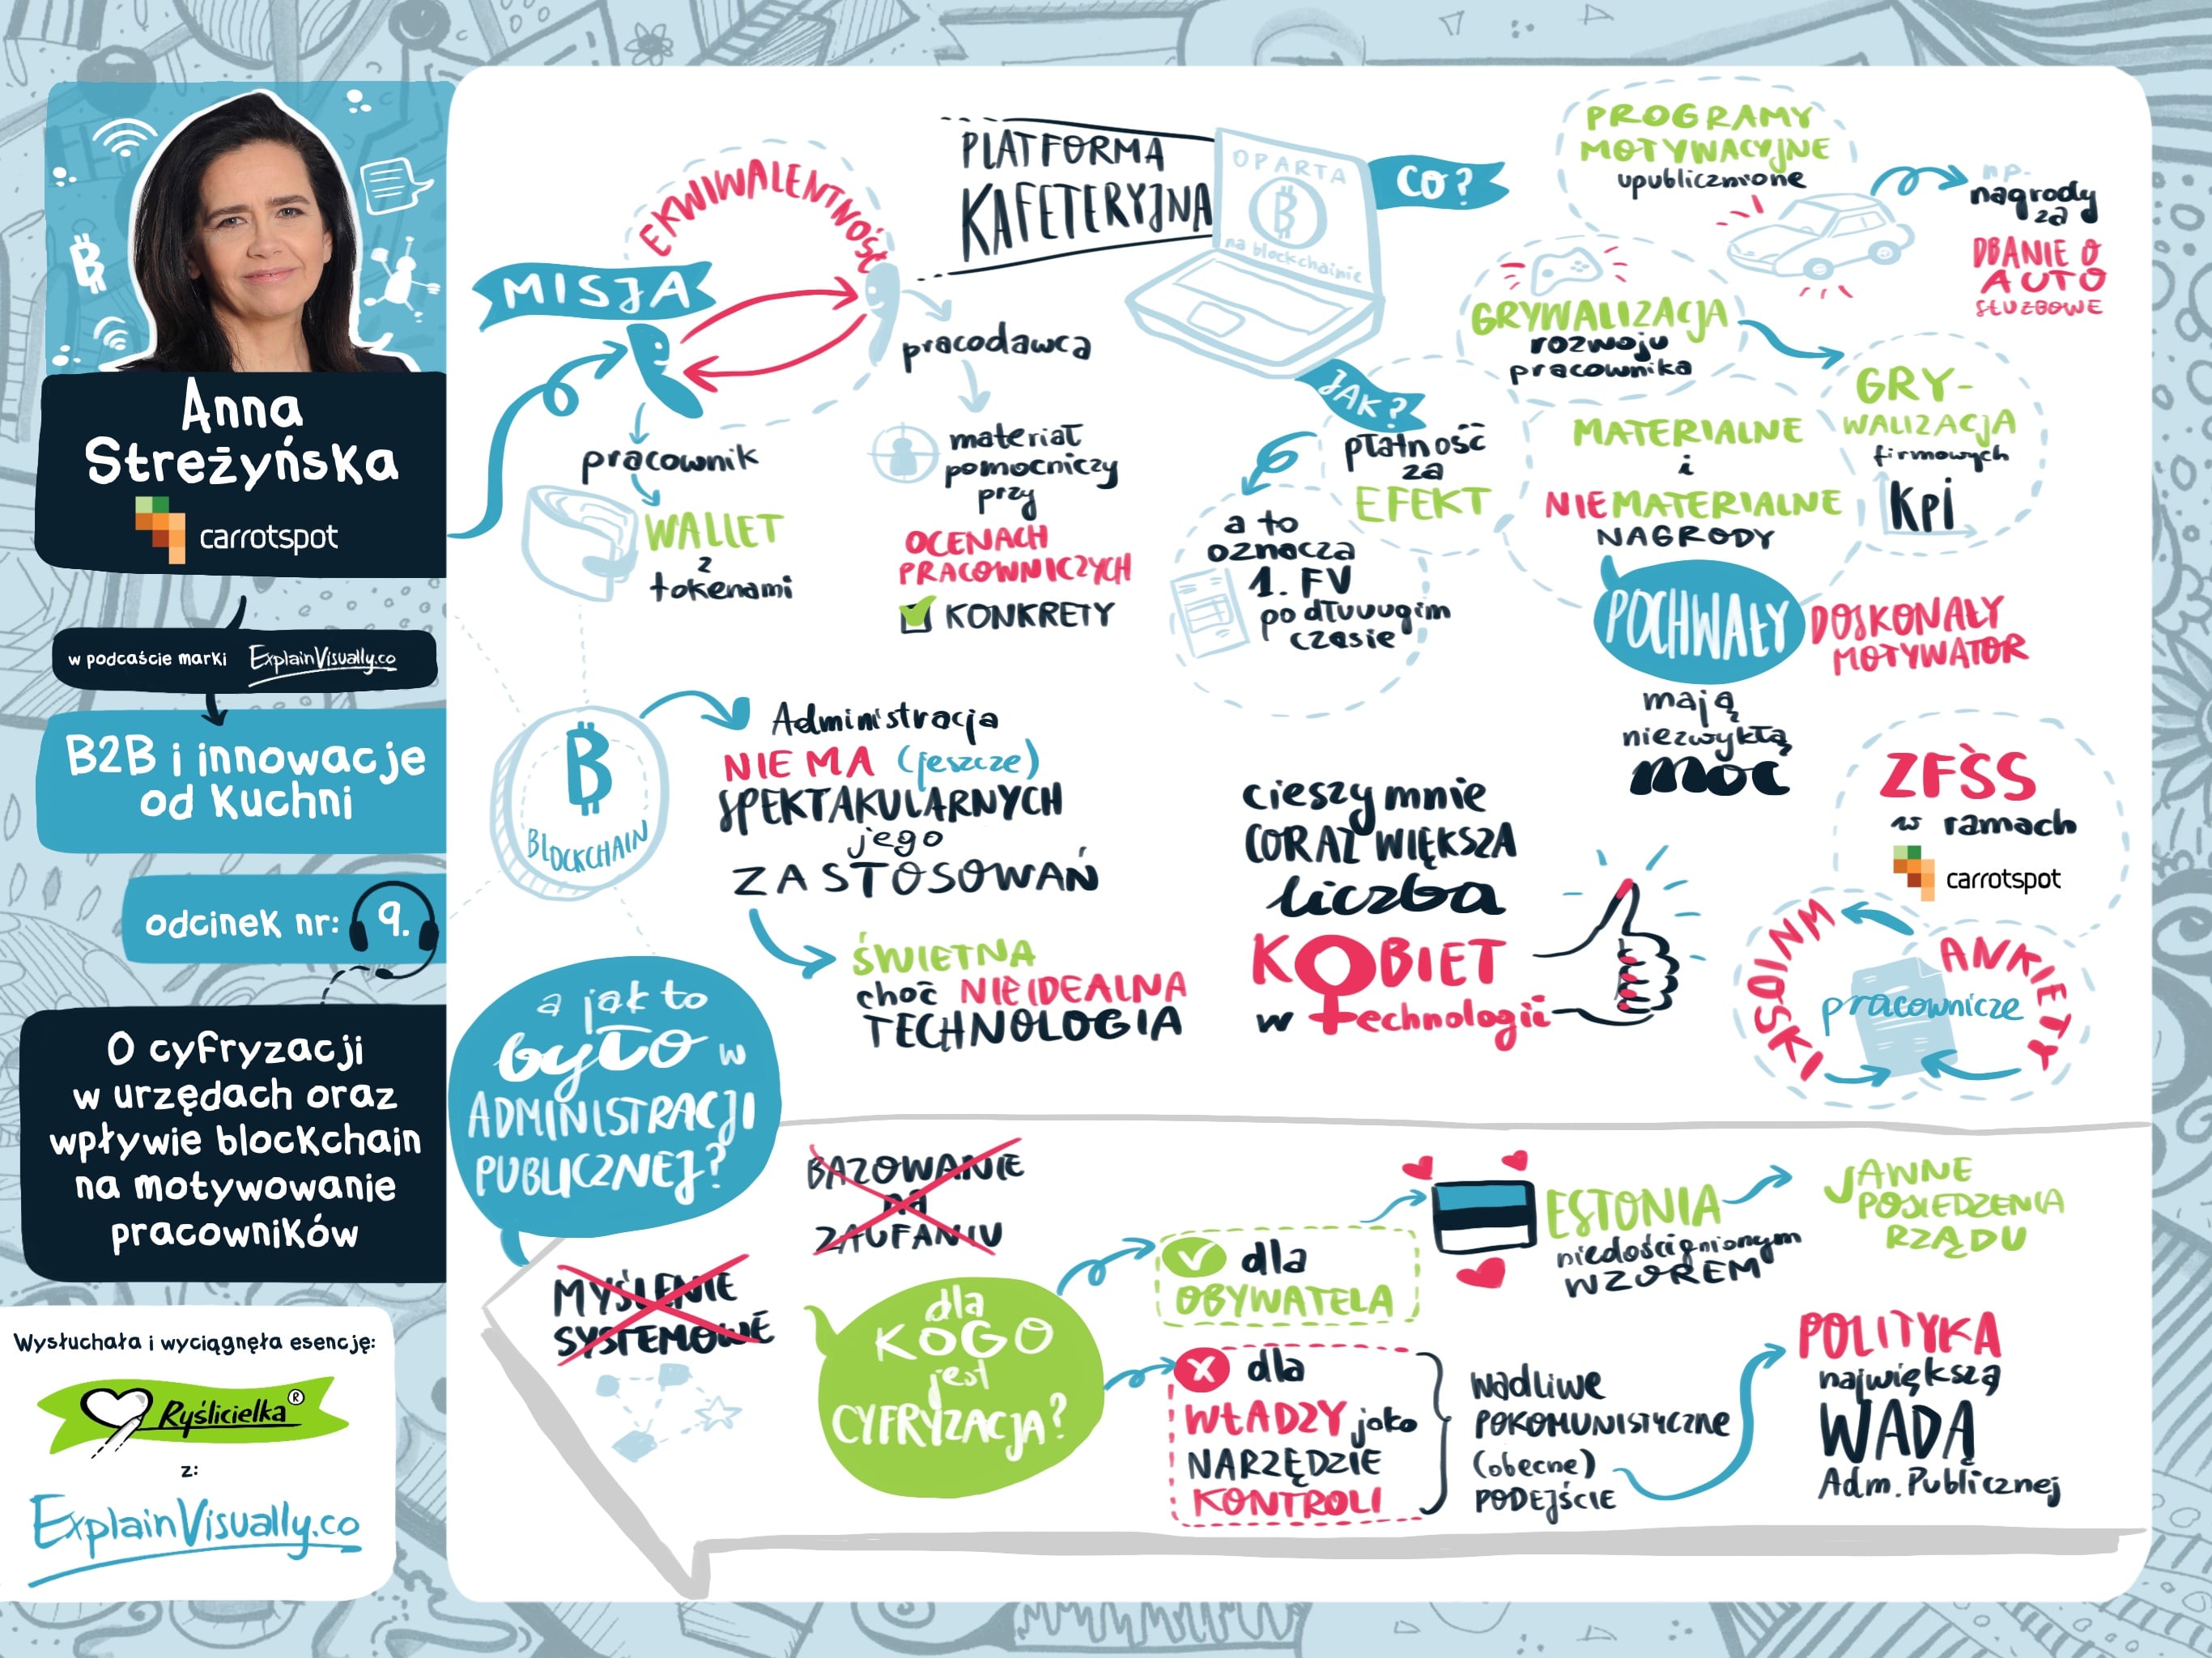
Wizualne podsumowanie naszego podcastu z Anną Streżyńską
O co zadbać, zabierając się za myślenie wizualne
Jak widać jest spora różnica między dodaniem ikonki do slajdu, a stworzeniem złożonej wizualizacji podsumowujacej strategię firmy.
Im bardziej zaawansowanym myślicielem wizualnym jesteśmy, tym więcej jesteśmy w stanie zrobić. Poniżej parę informacji nt. elementów o które warto zadbać zanim zaczniemy działać.
1. Zrozumienie grupy docelowej oraz kontekstu
Lekcje dot. dbania o zdrowie będą wyglądały inaczej gdy są kierowane do nastoletnich sportowców niż gdyby były kierowane do 50-letnich bankierów.
Zmieni się kolorystyka (bogata paleta barw zamiast stonowanej kolorystyki), forma (np. rysunek zamiast grafiki komputerowej) czy język.
Warto też poznać szerszy kontekst, tzn. gdzie będzie pokazywany dany materiał, co takiego było dotychczas najtrudniejsze do zrozumienia itp., itd.
2. Zebranie wszystkich informacji w jednym miejscu.
Żeby połączyć kropki w sensowny kształt, trzeba najpierw te kropki zebrać. Dlatego tak ważne jest, aby osoba zajmująca się myśleniem wizualnym miała dostęp do wszystkich niezbędnych informacji.
3. Zrozumienie sedna przekazu.
Bez dotarcia do sedna przekazu trudno jest ten przekaz zwizualizować. Dlatego profesjonalista zajmujący się myśleniem wizualnym będzie często zadawał wiele pytań, zanim przystąpi do pracy.
4. Uporządkowanie informacji.
Co jest najważniejsze? Co można pominąć? O czym mówimy najpierw, a o czym dopiero na końcu? Na te pytania trzeba znaleźć odpowiedź.
5. Wykorzystanie dobrych praktyk designu i/lub storytellingu.
Gdy już wiemy co przekazujemy, nadchodzi (dopiero) czas na dobranie do tego odpowiedniej formy wizualnej. Tutaj trzeba mieć wiedzę z zakresu designu, aby obraz był przejrzysty i atrakcyjny wizualnie.
6. Przygotowanie materiału do publikacji.
W zależności od tego czy materiał będzie wysyłany, prezentowany czy wyświetlany na evencie, trzeba dobrać do niego odpowiednią formę.
No dobrze, to jak to wdrożyć?

3 sposoby na wdrożenie myślenia wizualnego w swojej firmie
1) Wdrożenie na własną rękę
Jeżeli chcesz się dokształcić w temacie myślenia wizualnego, to polecamy książki:
“Narysuj swoje myśli” Dan Roam,
“Slajdologia” Nancy Duarte,
“Myślenie wizualne w biznesie” Karolina Jóżwik, Szymon Zwoliński
“Notatki wizualne” Natalia Mikołajek
Poza tym pomocne będą portale z ikonami takie jak:
Oraz portale ze zdjęciami stockowymi:
czy darmowy unsplash.com
Oraz aplikacje do tworzenia grafik takie jak:
oraz Figma.
2) Szkolenie w firmie, która się w tym specjalizuje
Możemy pomóc Tobie lub Twoim kolegom z pracy w opanowaniu myślenia wizualnego.
Mieliśmy przyjemność propagować ten nurt w Polsce już w 2010 roku (a więc ponad 10 lat temu!). Przez te lata pracowaliśmy m.in. dla takich firm jak Google, IKEA czy ING.
Jeżeli chcielibyście przeszkolić swój zespół, możecie poczytać o tym więcej tutaj.
3) Zlecenie projektów opartych o myślenie wizualne zewnętrznej firmie
Jeżeli chcesz zrealizować grafiki, animacje czy warsztaty, możesz to zlecić na zewnątrz. My zajmujemy się tym od 2010 roku, także chętnie pomożemy w realizacji też Twoich projektów.
Przez te lata zrealizowaliśmy ponad 350 inicjatyw w 19 językach, pracując zarówno dla małych firm jak i dla korporacji takich jak Carlsberg, Pfizer czy Santander.
Jeżeli chcesz dowiedzieć się jak możemy Ci pomóc, możesz poczytać więcej tutaj.

He has studied psychology at the University of Warsaw, and business at Warsaw School of Economics, as well as at University of Cambridge Judge Business School. During his studies, he has researched how people think when they are overwhelmed by information.
It has inspired him to focus on communication that explains complex subjects in a simple way. In Explain Visually, he has lead projects for companies such as IKEA, Carlsberg, Pratt & Whitney, Orange, and Pfizer. Fan of rational, science-based approach, and building marketing and sales on robust fundamentals.


