What is visual thinking?
Imagine this situation…
You get up in the morning. You reach for your cell phone and there is a black and white screen and a wall of text. You walk over to your desk and check your planner. A wall of text again! Even the division into days of the week is gone. In addition, all calendars have disappeared from the house, including those hanging on the wall.
You don’t know what’s going on. When you get in the car, it turns out that the GPS does not switch on, and instead of signs on the road, there are black and white plates with detailed slogans: turn left in 400 meters, stop right in front of this sign, do not cross the continuous line in front of you, slow down to 20 km/h, look around if you see any danger.
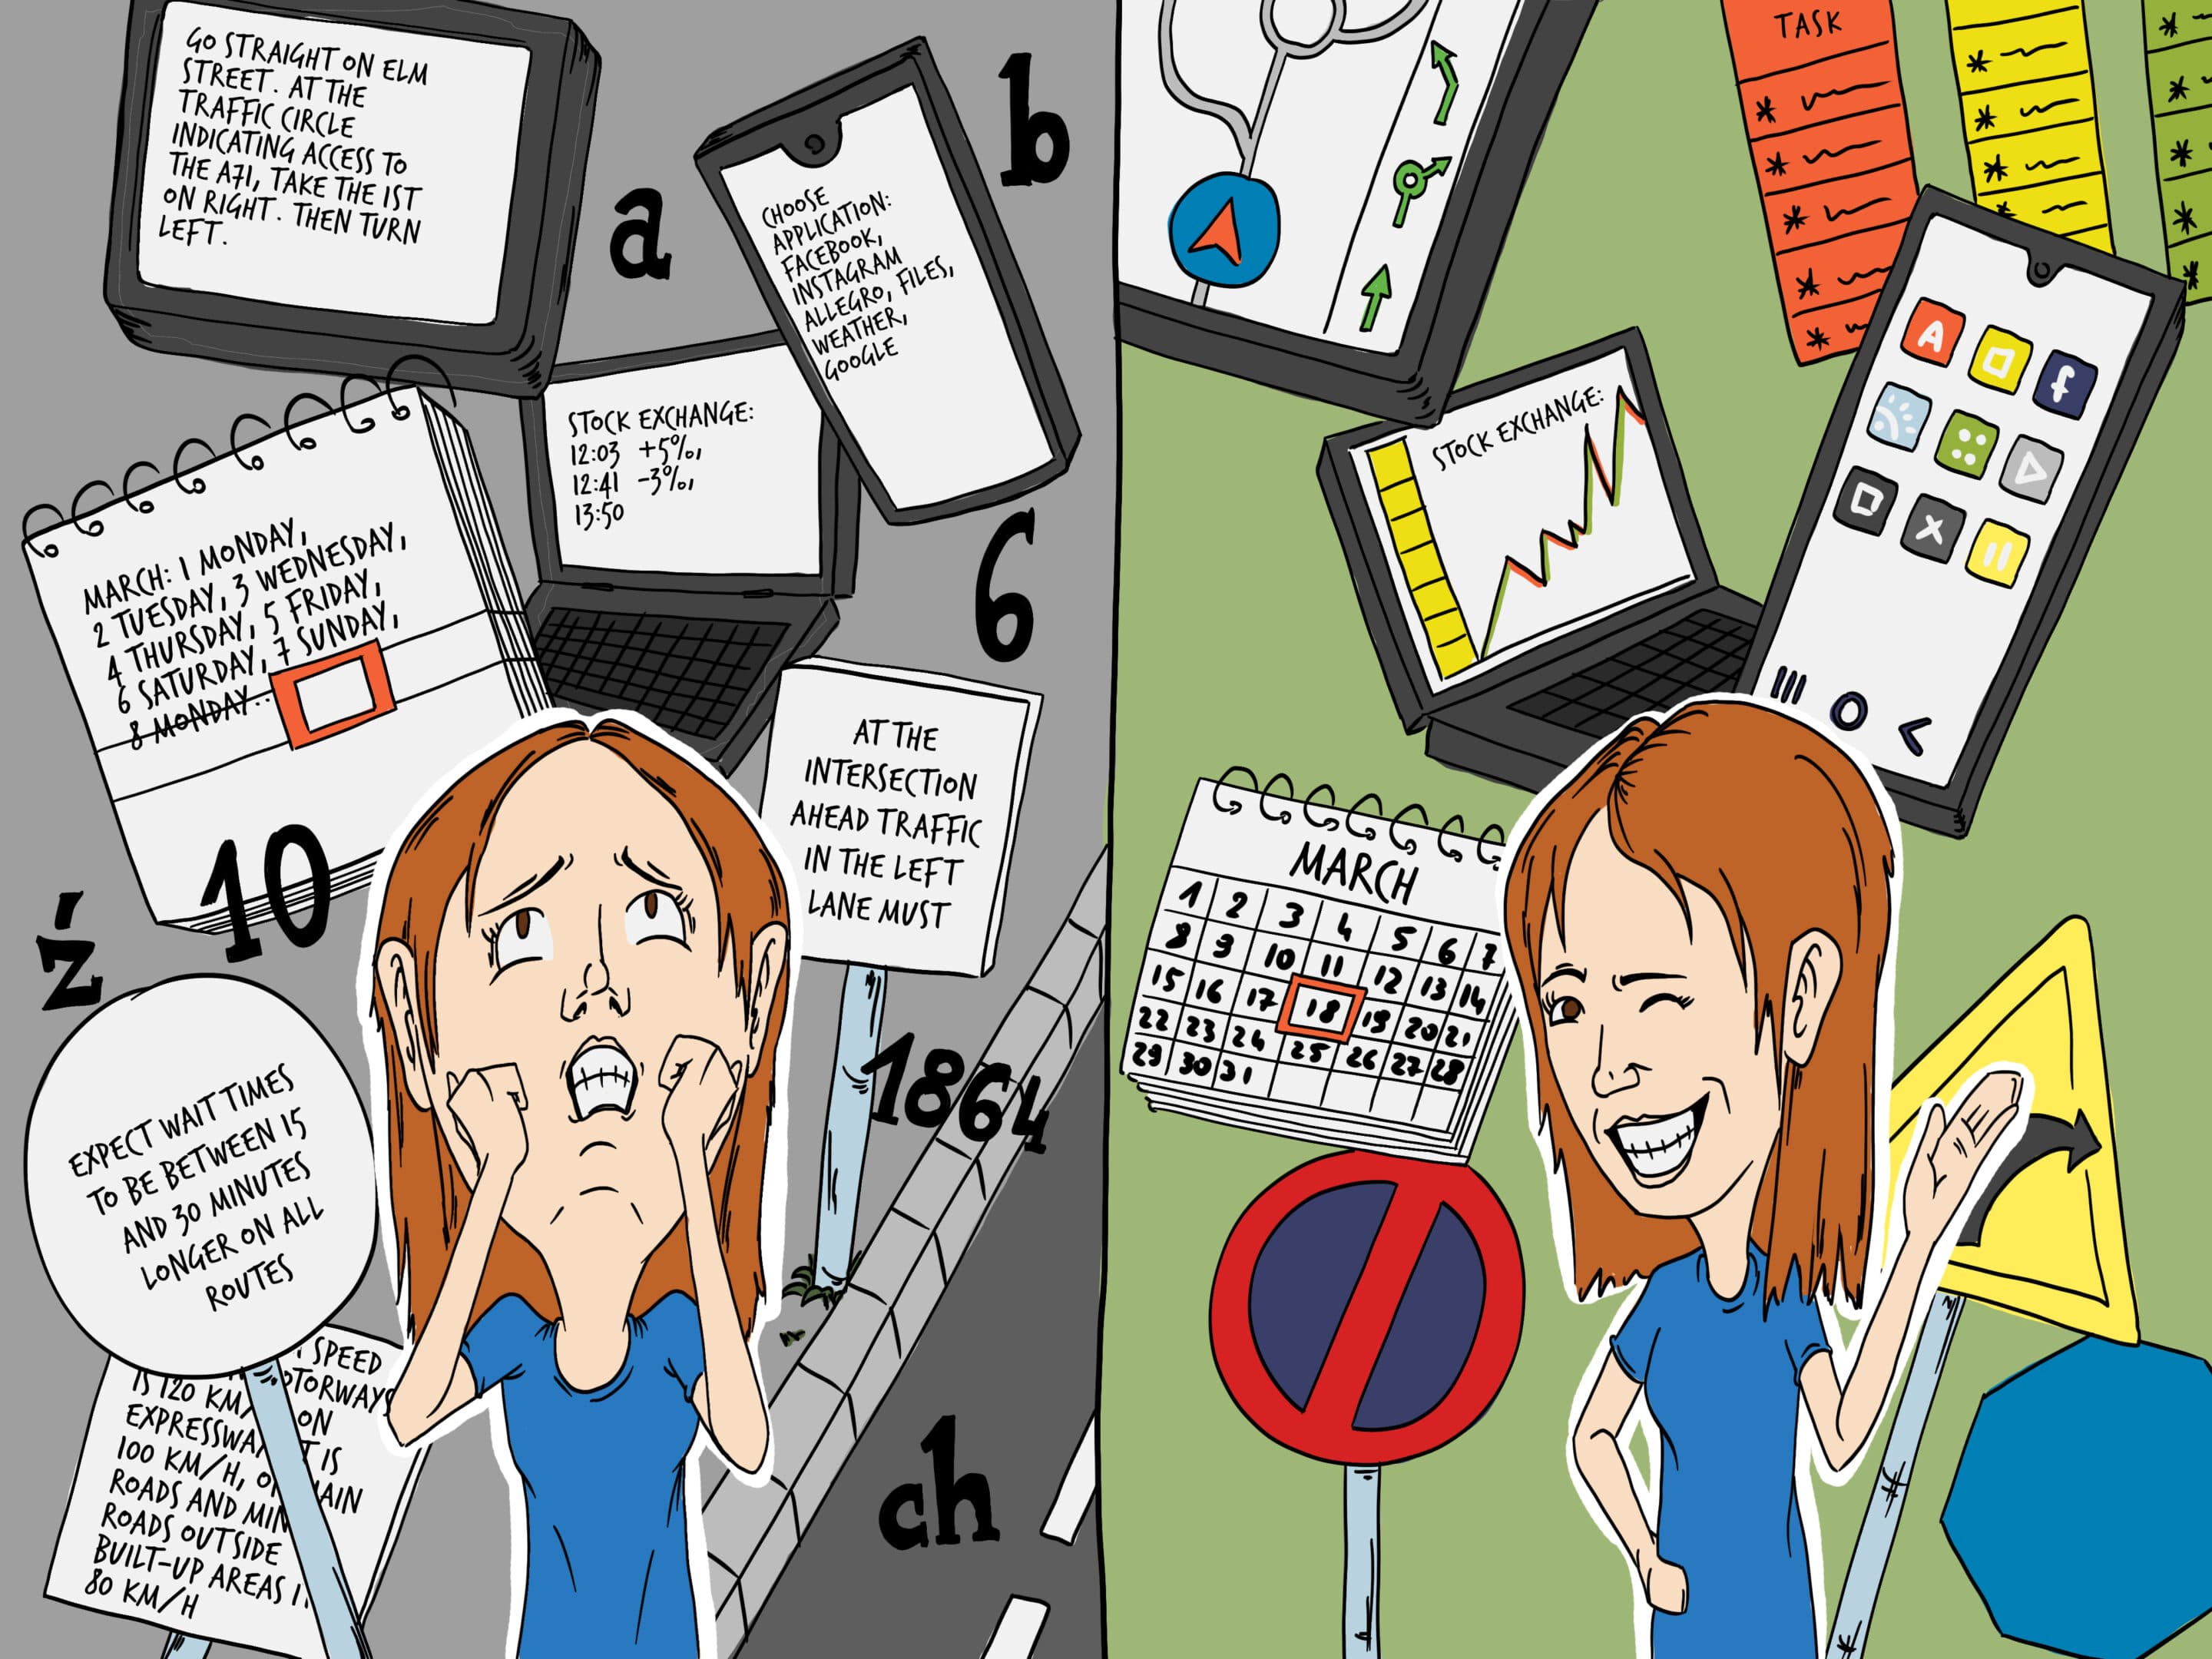
The world would look like in the picture on the left if we stopped using visual thinking.
On the Polish website mysleniewizualne.pl we can read that visual thinking “is thinking with images, using visualization in thinking. It results from the fact that people encode information in two channels: verbal and visual”.
The verbal channel is words and the visual channel is images. When a message is received in both these channels, we understand and remember it better.
Example: instructions for assembling furniture. Only using an audio version, it would be difficult to understand. Using images alone could also lead to confusion. Combining both channels turns out to be the most effective way. I write more about this further in the article on Pavio’s dual encoding theory.
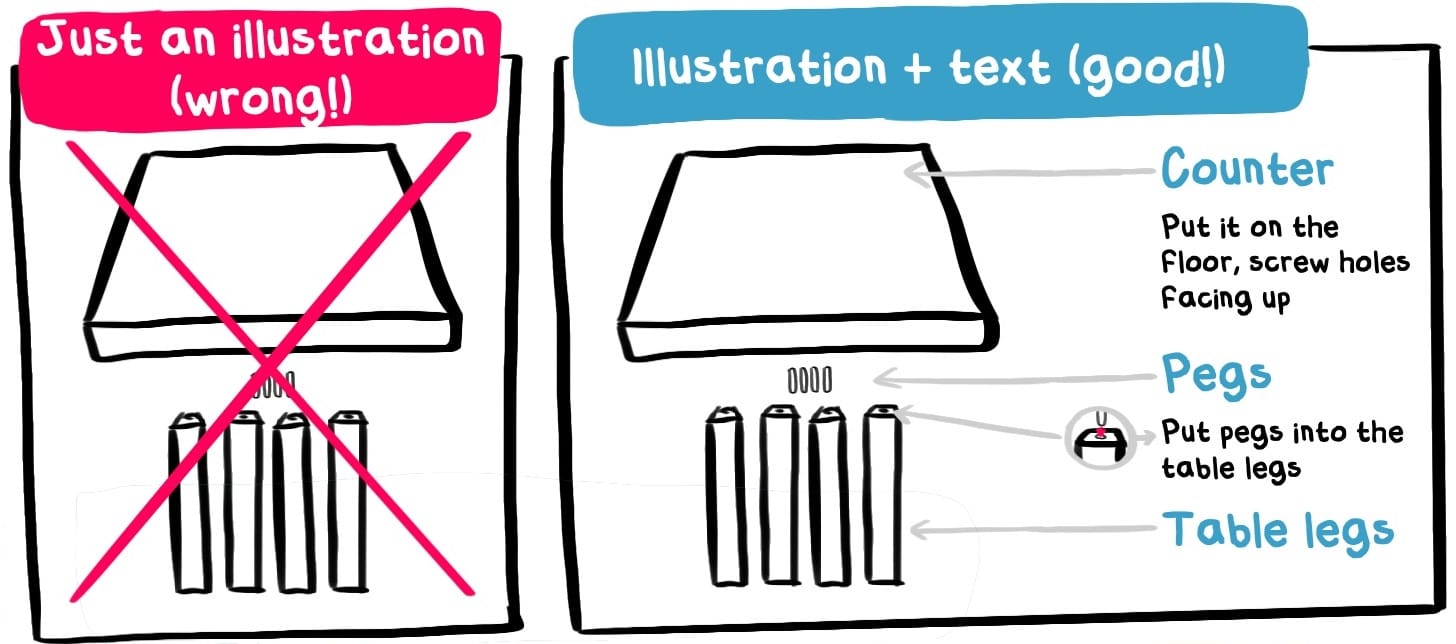
Visual thinking is the skillful combination of texts and images
We all use visual thinking every day. It helps us visualize space (road signs, maps), time (calendar, planner, timeline) and facilitates everyday functioning (e.g. through symbols, icons, e.g. when using a smartphone). It also helps in business (Gantt chart, tables, presentations, diagrams, and infographics).

A map is also a manifestation of visual thinking. Here: a map of the London Underground. Source: link
We can all benefit from visual thinking
Visual thinking is not taught in school in a structured and formalized way such reading and writing.
Yet we use it just as often as the cited skills, if not more often. We just do it unconsciously.
In the case of simple concepts, we do it automatically. When we hear “pink tie,” an image of a “pink tie” easily appears in our mind. There are two systems at work, verbal and non-verbal.
With more abstract phrases like “restructuring” we usually would not have an image appear. Therefore, it is easier to lose the thread and not remember the message.
This is explained by Professor Allan Pavio’s dual coding theory. According to this theory, we understand messages in two systems – verbal and visual.
Both systems are independent of each other, but there can be an exchange between them, i.e. words can turn into images in our mind and vice versa.
Why is this important? According to Pavio, when both systems receive stimuli, connections between them occur more easily. When we remember a piece of information using two systems, it is easier for us to recall it later.[1]
If we provide our audience with a visualization of “restructuring” on a slide, it will be easier for them to follow our presentation. In other words – they will use both systems at the same time.
Animation on the Santander way of working
Santander Bank has introduced a standard internal process for developing services and products. It combines a service design approach with agile and internal processes in the bank.
However, the bank’s employees are many, so training everyone on the new method and its advantages was a challenge. That’s why the Service Design Team asked us to prepare materials based on visual thinking, which would be an effective tool in training employees.
We prepared a 3-minute animation that Santander has been using since.
There’s a lot of talk in marketing about how important the visual side of advertising is. There are entire articles about the placement and color of buttons, the size of individual elements, and the direction of a character’s gaze. Ads are designed to quickly and visually represent often complex product features.
If it’s so important for ads aimed at customers, doesn’t visual thinking have broader applications in business? This is a rhetorical question – of course it does!
That’s what this article is about.
- First, we’ll look at how visual thinking can help in business.
- Then, in which departments and in which situations it can be applied.
- Finally, what forms it can take.
And rounded off with numerous examples.

Books on using visual thinking and visualization in business
How does visual thinking help in business?
1) It makes the subject easier to understand
To understand something, we often need to see it. It’s easier for us to remember a route when we look at a map than when someone gives us instructions.
In the same way, it is easier for us to understand instructions, company strategy or guidelines when we see them.
Visualization is especially useful with complex and abstract topics.
When we want to explain to employees a new process for running projects in the company, we can show it with the example of a road through which they are guided by successive signs and guidelines.
When conveying the advantages of our offer to customers, we can illustrate it on the example of a labyrinth, leading them through winding alleys, avoiding obstacles, and visualizing the benefits.
Everything can be presented using images.
Visualizations make it easier to understand the topic.
For example, two years ago we were approached by the company Akademia SkuteczneRaporty.pl. Its owner, Bartosz Czapiewski, wanted to show HR departments that the Academy’s training in PowerQuery was a good investment. He wanted them to see what value they could get from the course.
So we created a 2-minute animation, which simply and non-technically told about the advantages of the course. The result? Potential customers understood what the course was about and what they could gain from taking the course.
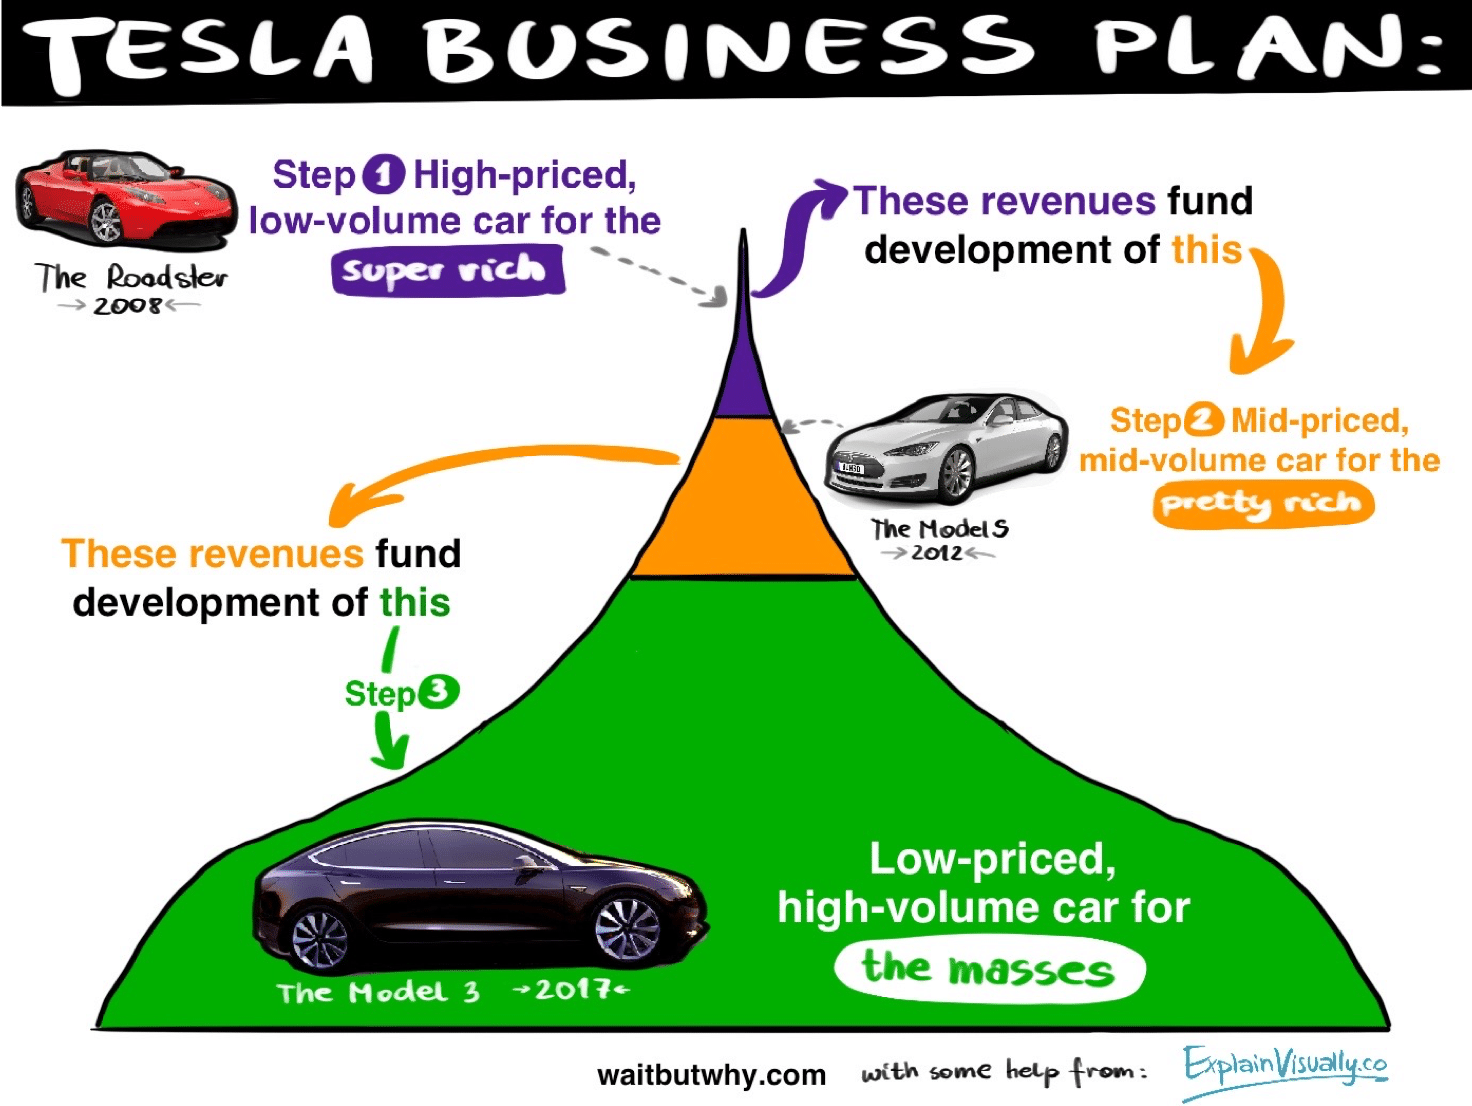
Tesla business plan presented visually
Skillful use of visual thinking allows to reach the target group more effectively
Jeff Hawkins is the creator of PalmPilot, founder of Handspring, and an author of books on the brain and intelligence. He leads many discussions and lectures on the functioning of the brain.
Depending on the target group, his lectures are slightly different. And not in terms of what he says – that remains the same. What differs is the visual aspect.
When he presents the topic to experts, the drawing showing how the brain works is elaborate. But when his audience are laypeople without specialized knowledge of neurology, the picture is simplified.
This ensures that each target group understands the lecture and gets more out of it.[2]
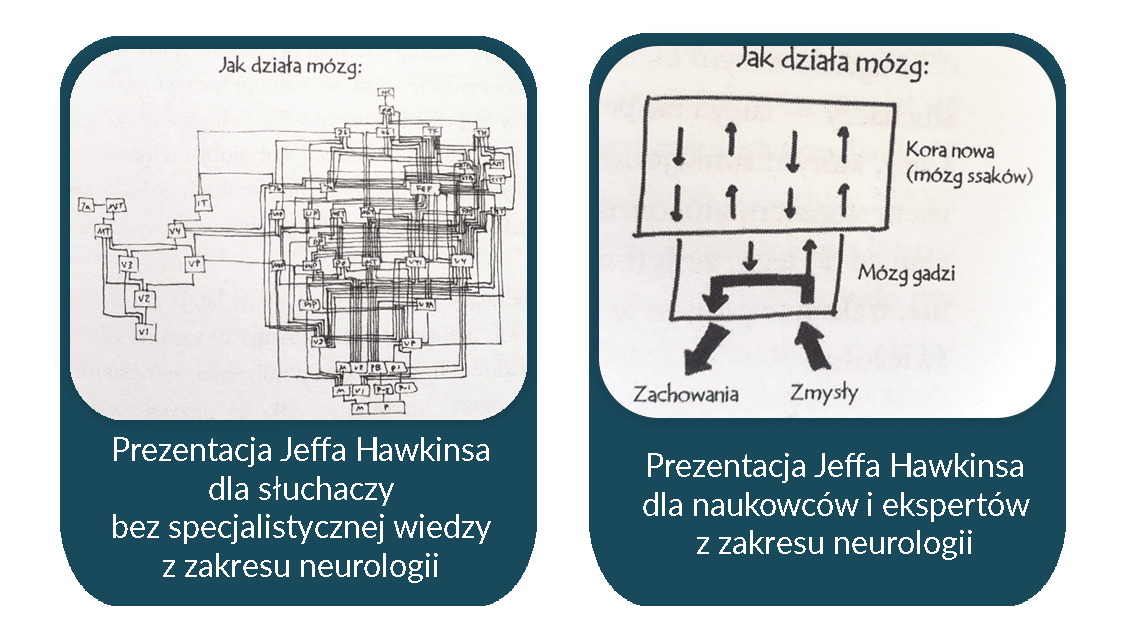
Different drawings for presentations on brain function, depending on the target group. Source: Dan Roam, “Draw Your Thoughts,” One Press, 2008
2. Visual thinking makes it easier to remember
If you open any book on memorization and learning to learn effectively, you will see that most mnemonic techniques are based on visual thinking.
For example, associating numbers with objects/persons/places and making up stories about them so that you can later remember complex mathematical formulas.
Conduct an experiment. Read the following 10 nouns, then close your eyes and try to recall them.
1) Pen 2) Card 3) Building 4) Phone 5) Podium 6) Safe 7) TV 8) Table 9) Tiger 10) Arrow
Now do the same with these adjectives:
1) Positive 2) Equal 3) Relative 4) Transparent 5) Clumsy 6) Unpredictable 7) Transparent 8) Specific 9) Urgent 10) Confusing
It’s easier with nouns because they immediately appear in our minds as images.
And this is where visual thinking is useful. It allows you to represent pictorially what is difficult to imagine right away. Yes, even adjectives. Therefore, it makes it easier to remember and understand even very intricate and complicated topics.
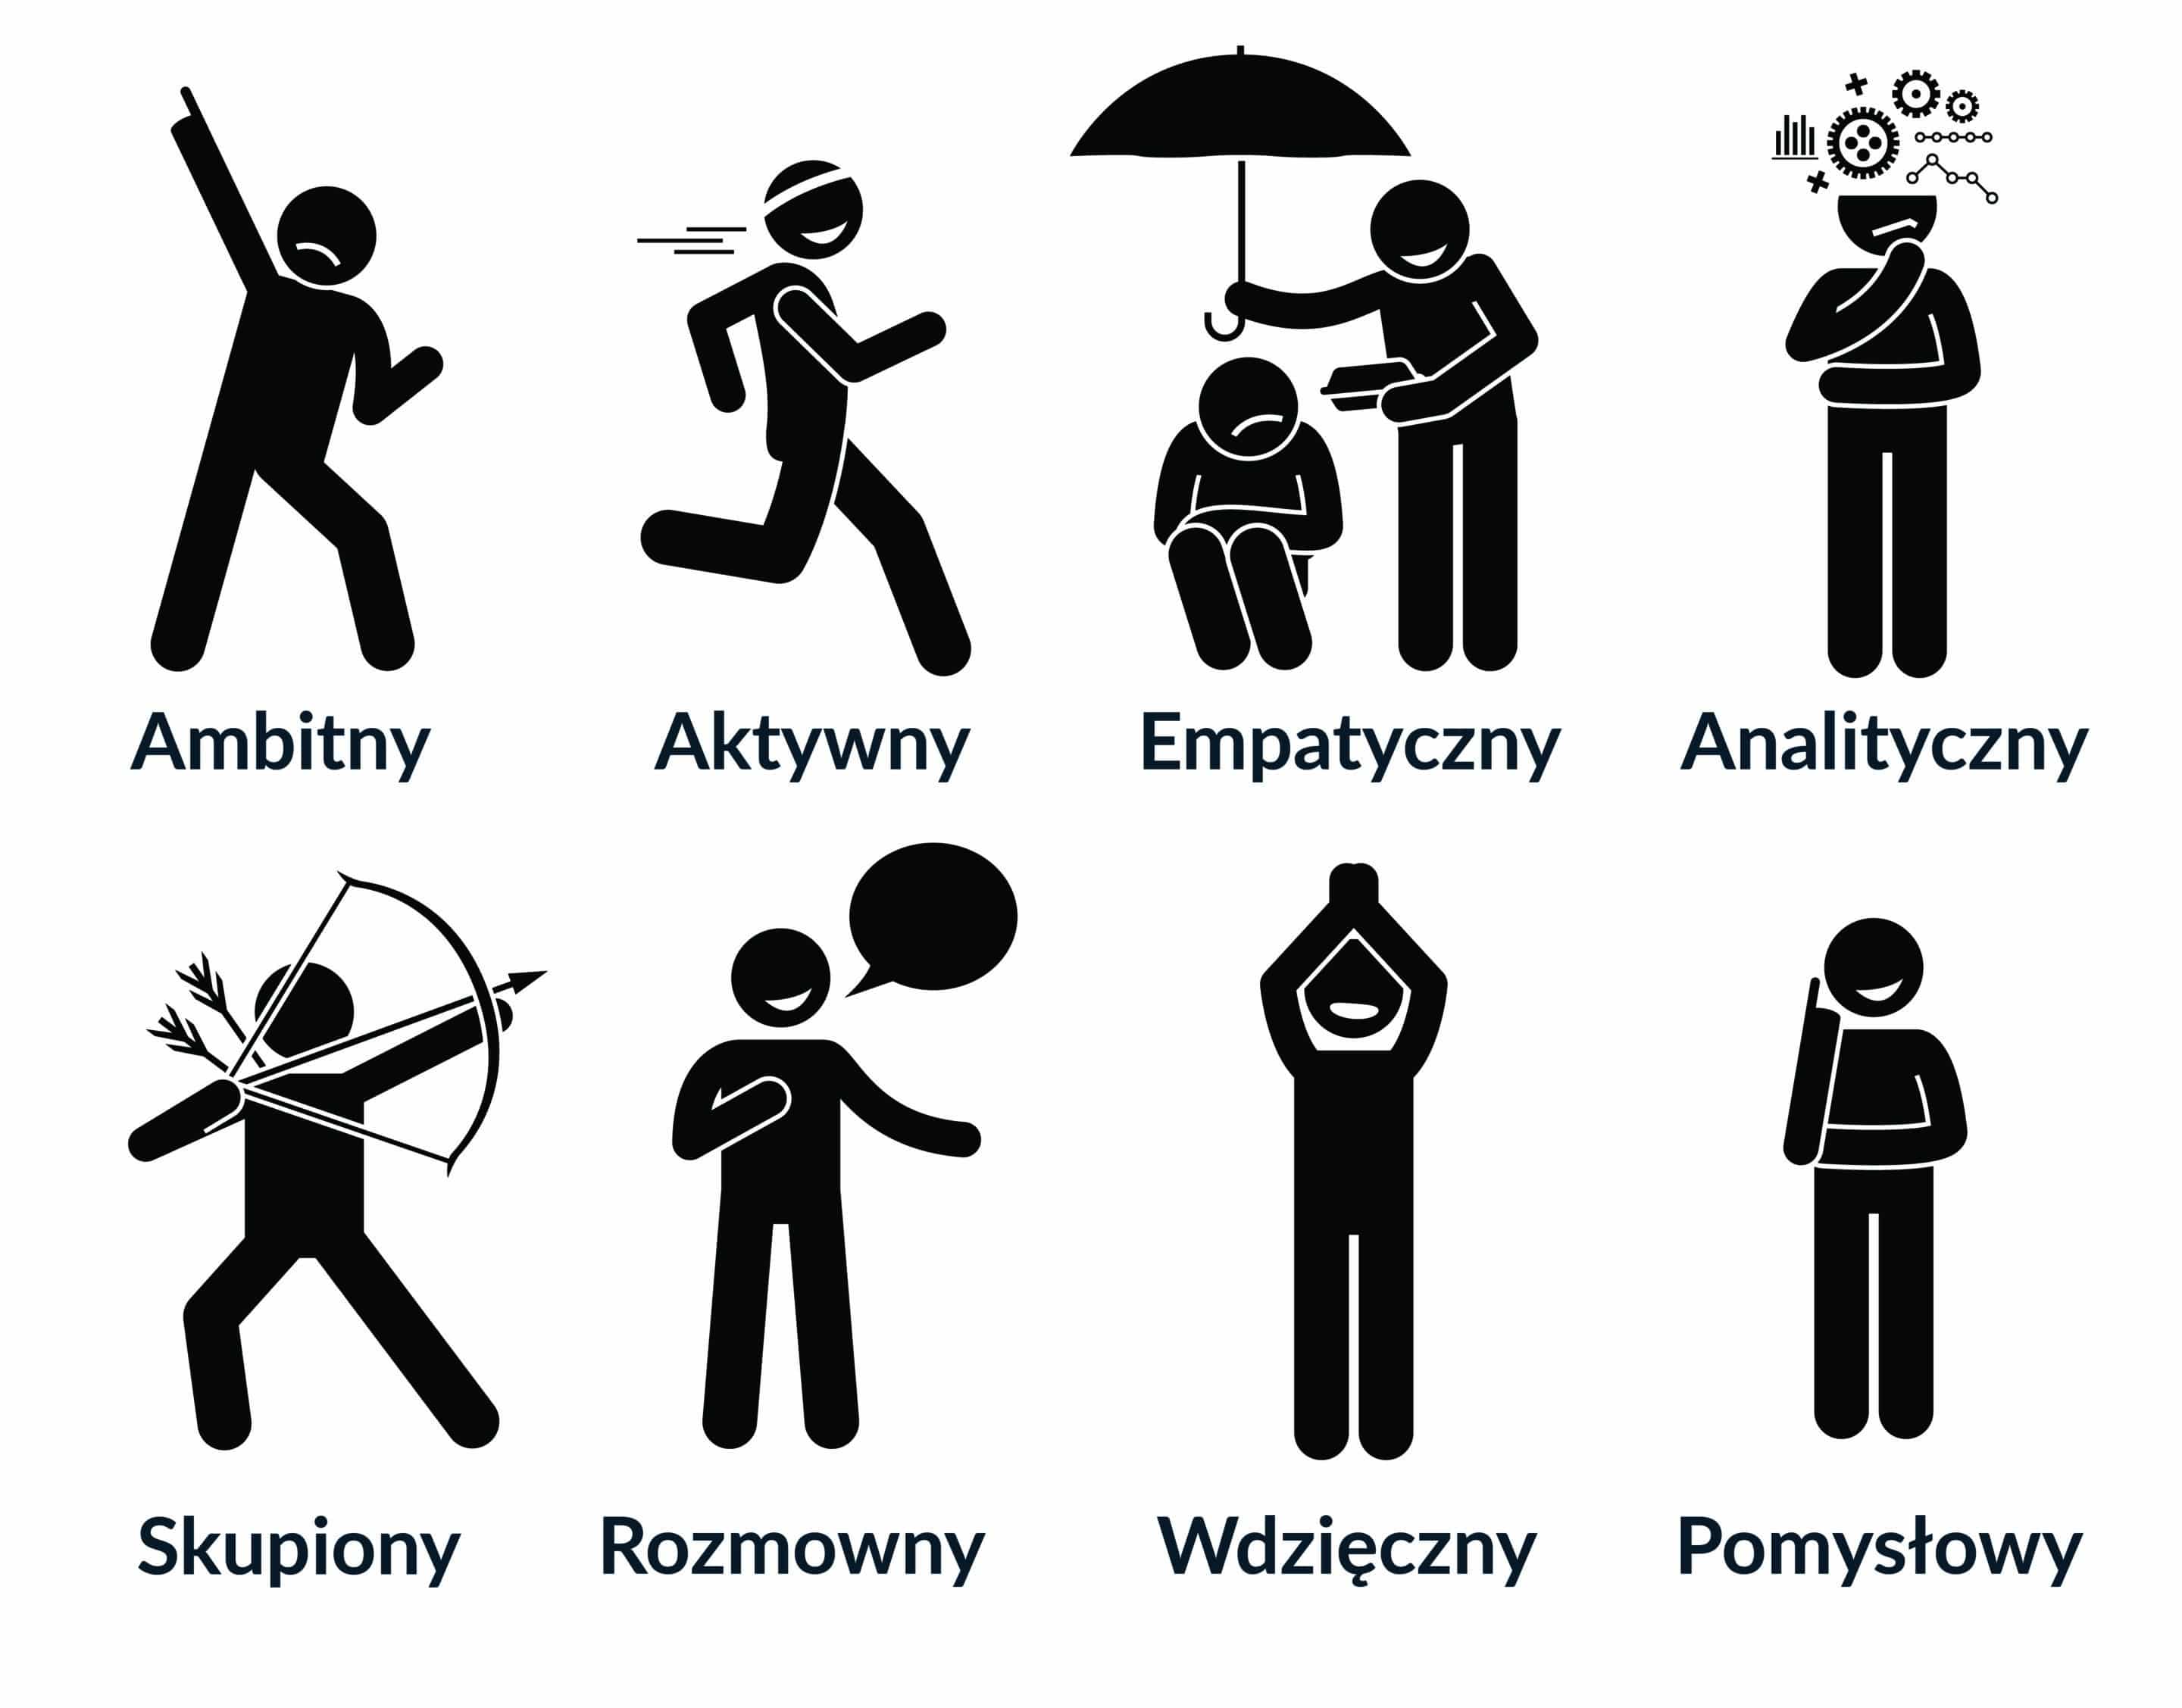
Adjectives shown visually
An experiment by Professor Richard Wiseman
One of the manifestations of visual thinking is animation. There is more and more talk about the effectiveness of whiteboard animation in transferring knowledge. Professor Richard Wiseman, a renowned psychologist, decided to check its truth. In 2012, he recorded a video in which he explains one of the theories of philosopher William James. He then created a simple whiteboard animation in which he used an audio recording from his video. He showed it to a group of 2,000 people.
Viewers who watched the whiteboard animation gave the correct answers 15 percent more times compared to those who watched the video. Moreover, with the animation, there was a 66% increase in the number of people willing to share it further.[3]
Anyone involved in education or research knows that this is a colossal difference. Normally you have to work very hard to get a 5, maybe 10 percent increase in any variable in behavior. The animation alone produced a 15 percent increase. “It’s staggering,” Wiseman said.[4]
According to the professor, this is because whiteboard animation engages the audience more and has an element of fun.
The animation used for the professor’s experiment
3. Visual thinking encourages innovative thinking
What does this mean?
By writing down and drawing ideas, meeting users can see the connections between them, and the common points. This allows participants to look at processes or problems from a different point of view.
Visual thinking is a surprising and creative way to clarify and inspire ideas among groups of people. Within business, creativity is fundamental for generating change and innovation.
Visual thinking is able to enrich the transformation process that leads businesses to flourish as through images and keywords it may connect diverse perspectives, facilitate shared understanding and accelerate decision-making.
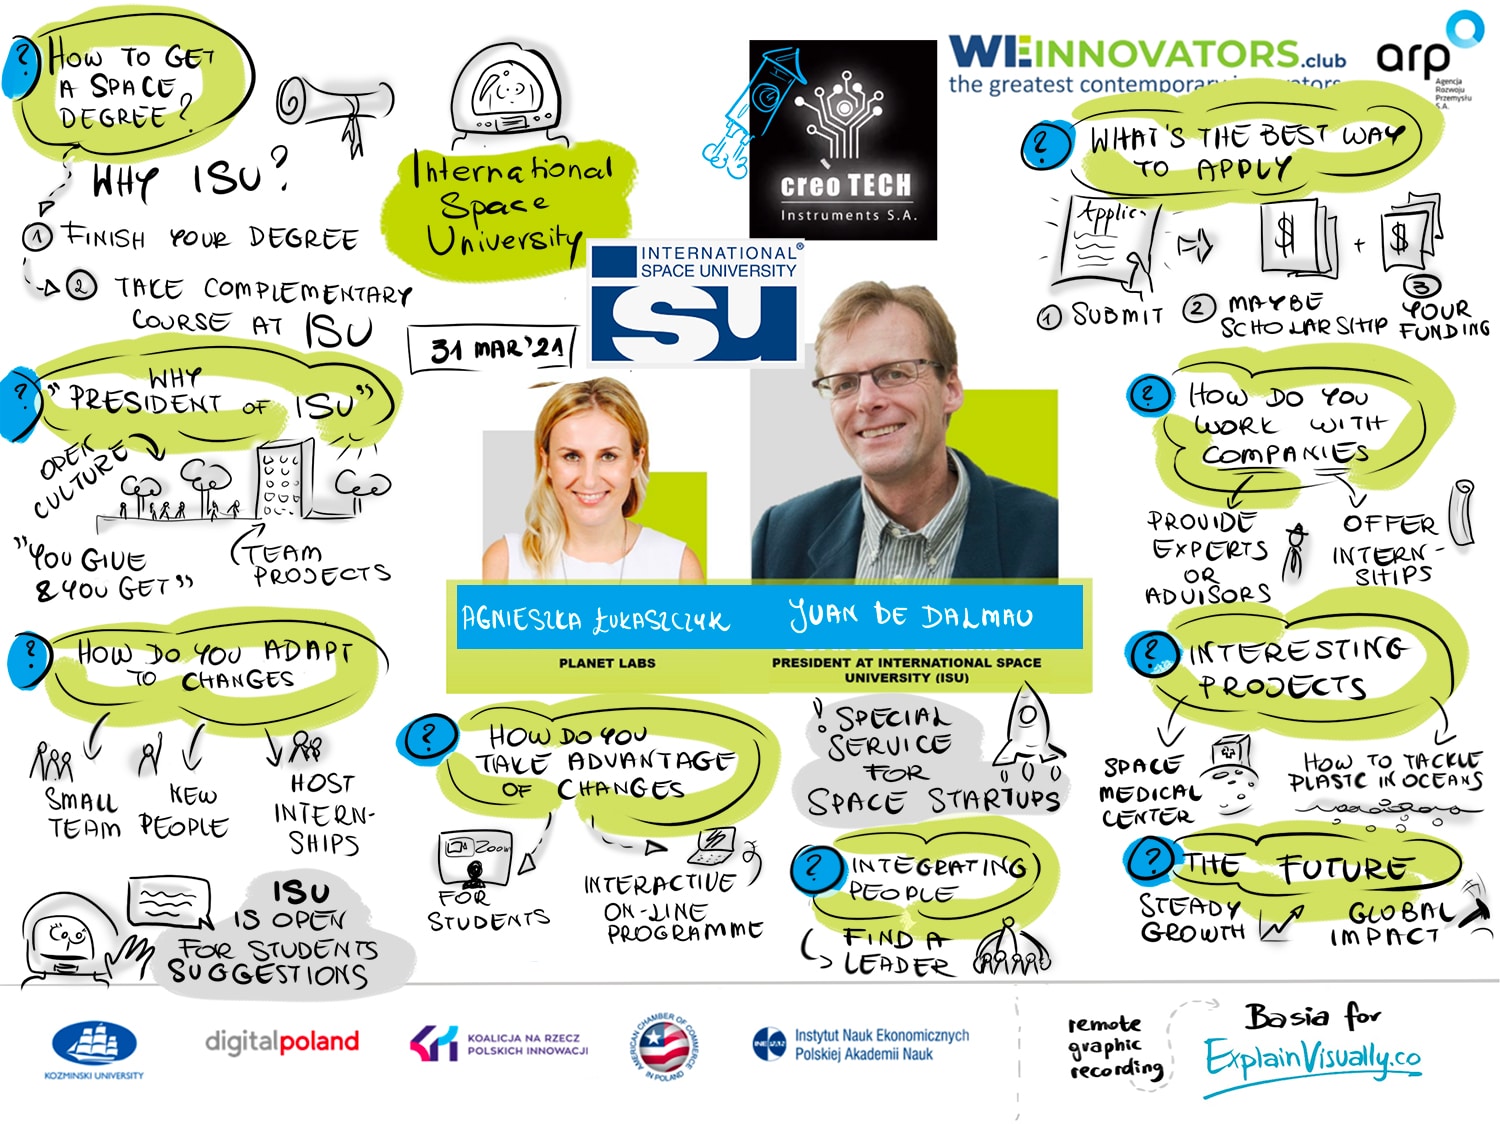
Digital Graphic Recording for We Innovations
4. Increases team engagement and focus
During a long corporate discussion, presentation or training, it’s hard to keep your audience’s attention. And in times when everything has moved online, this is even more difficult. Employees are tired of online meetings. There is a lack of interaction, stimuli and sitting on Google Meets or Zoom is not conducive to concentration.
This is where visual thinking comes into play again. Visual notes and graphic elements add variety to meetings, catch the eye, and help organize thoughts. They are engaging both in live and online meetings.

Klaudia Tolman while working on a graphic recording of a conference
Nowadays, especially in business, we often strive for some form of perfectly and clearly structured communication.
However, our minds and our thinking processes are never perfectly and clearly structured. Visuals, whether it be diagramming on a canvas or simply using visual organization to structure your thought process, help not only to spark memories of previous conversations, but also to support greater understanding of the whole as well thus helping people be more engaged.
Complex thoughts can be explained in a much more involving and interesting way.
5. Visual thinking broadens horizons
The moment you start drawing, the moment you start looking at reality in terms of how it can be visualized, what a teapot or a tea brewer looks like, for example, you start looking at the world differently. You see more details, the world is fuller – says Klaudia Tolman.
Bringing it down to business issues: we are able to look at company processes from a different perspective. And not only look at processes but team problems, customer needs, and internal rules.
Visual thinking broadens our spectrum of view.
Klaudia Tolman conducted a workshop for IKEA, in which sales managers participated. They drew up, among other things, the customer’s purchase path.
It seems that the customer’s journey through the store, his interactions are known to all managers … “how much can you do”. And yet seeing it in such a visualized way allowed them to literally expand their thinking about it. Then it’s also easier for them to bring that map to mind – Klaudia Tolman said in our podcast.
6. Clearly summarizes the text/conversation
Another advantage of visual thinking: it leaves behind a clear visual note of the meeting/conversation/document. It allows you to extract the most important information from the message and gather it in one place.
As a technical coach, I sometimes use these skills on a whiteboard or a flipchart to explain and compare ideas. These notes have a lifetime of a few hours to a few days. They really help get ideas across.
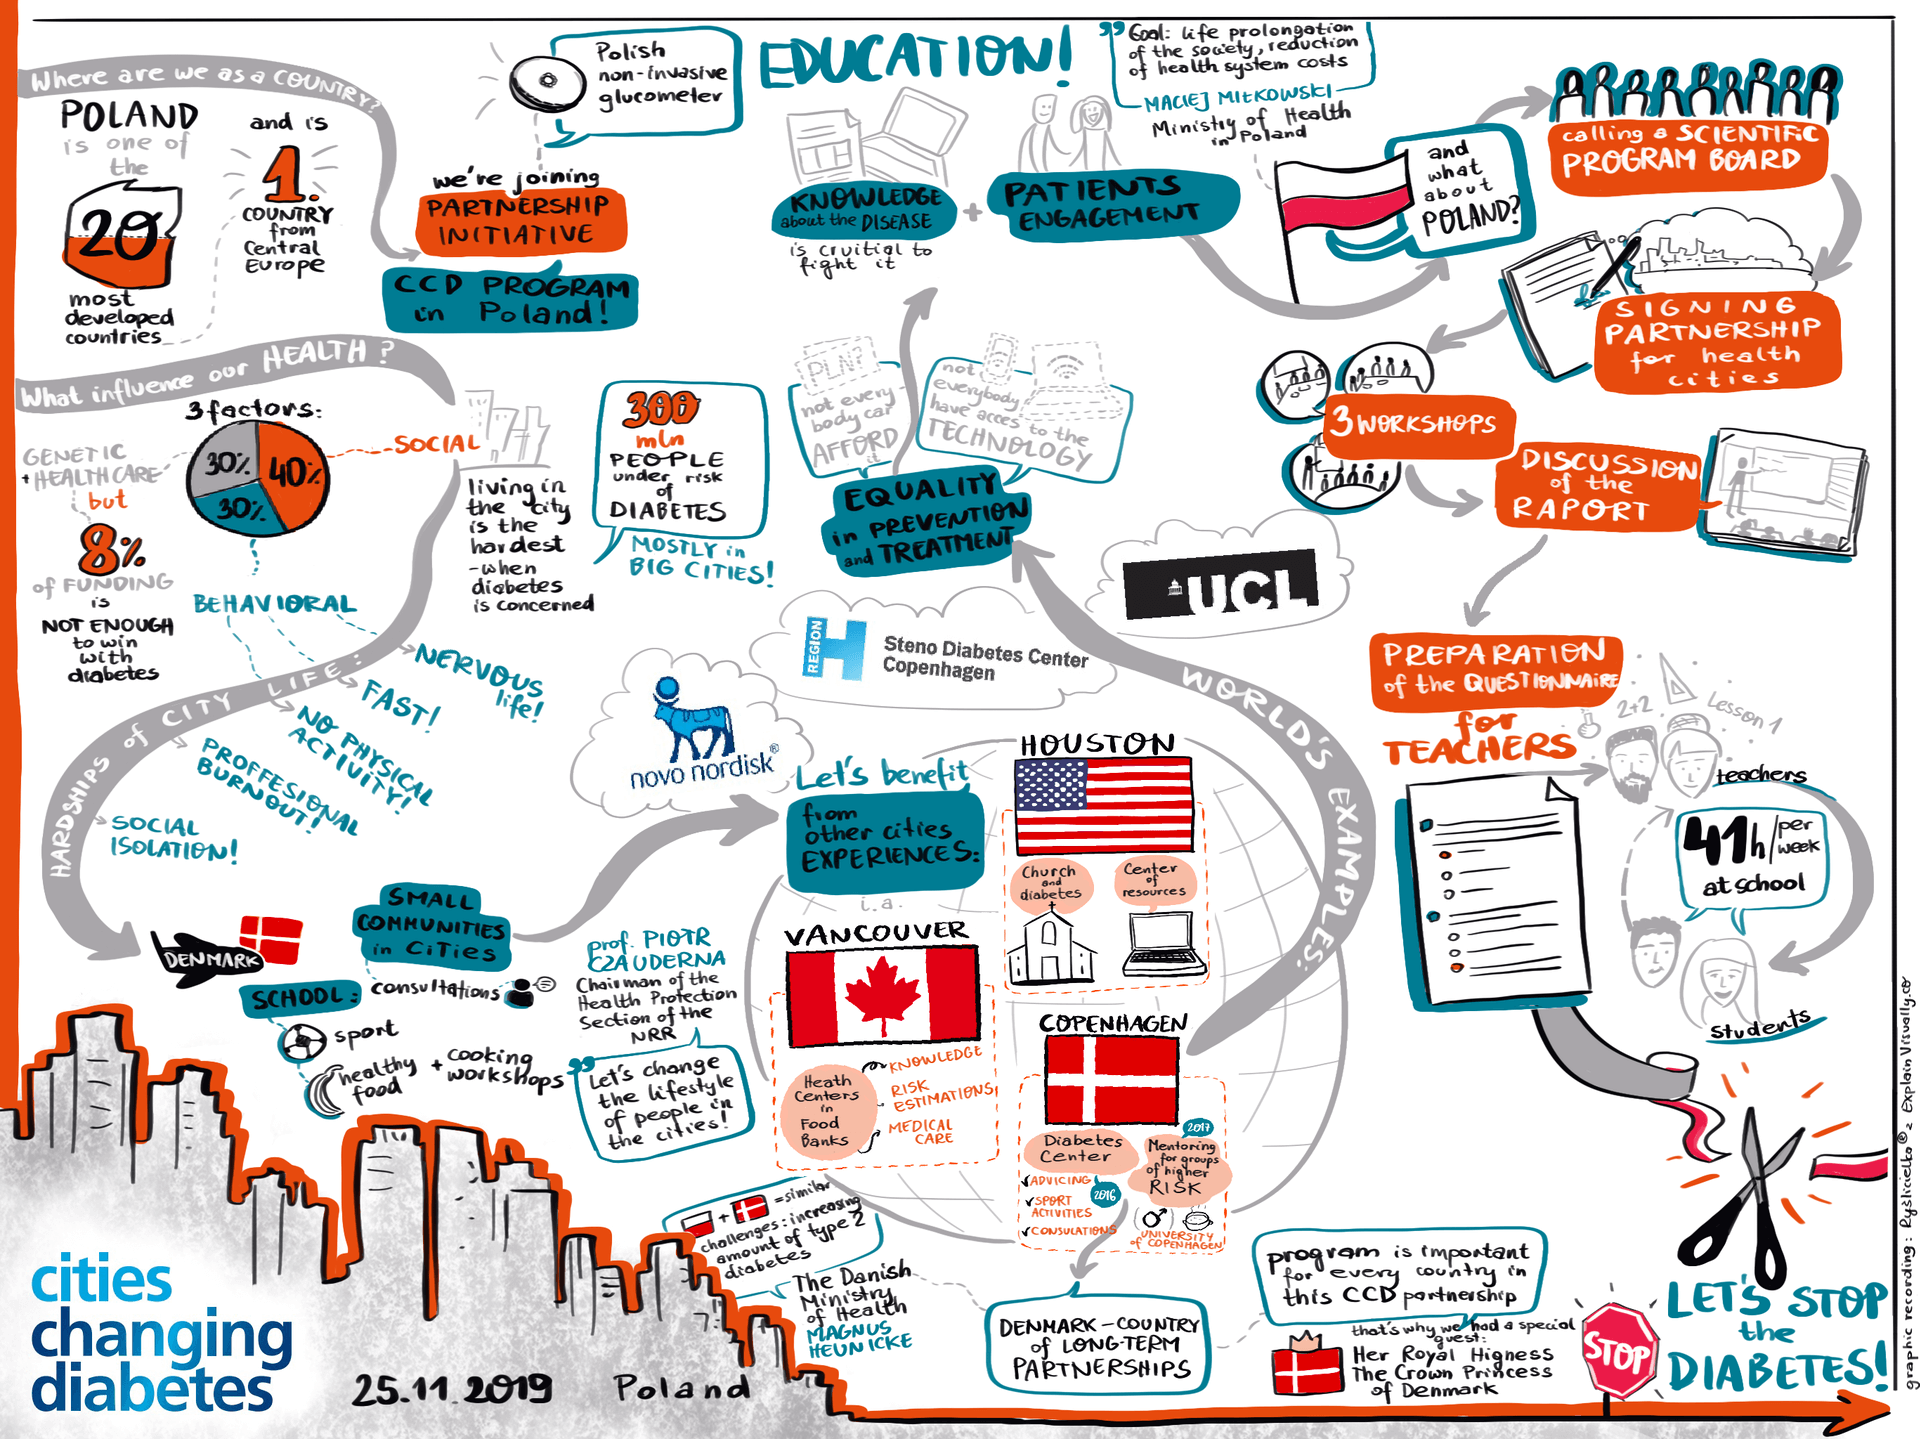
An example of a digital visual note made by Klaudia Tolmanduring “Cities changing diabetes” conference.
Polish study on visual thinking
In 2018, we made a small contribution to a study on the effectiveness of visual thinking. The 2018 study was conducted by CZIITT, which is the Center for Innovation Management and Technology Transfer at the Warsaw University of Technology.
It was conducted using the method of online surveys (CAWI). The main goal was to find out what people remembered better – a read only text or a video with visuals (whiteboard animation/explainer video).
The respondents (over 1000 in total) were divided into two groups.
- The first group read a text.
- The second group watched a video depicting that text, and that video was enhanced with visuals.
The whiteboard animation proved to be a better method of conveying information than the text. Regardless of the gender, age or area of professional activity of the respondents.
In doing so, the respondents indicated that they preferred visual communication to text alone.
More about it here.
Applications of visual thinking in business
Visual thinking can be useful in all departments and activities of a business. So the following list is intended to be a helpful signpost and inspiration to start using visual thinking in business.

David Sibbet, often called the Father of Visual Thinking by the visual thinking community, including the International Forum of Visual Practitioners, has written three books on using visual thinking in business.
Management
Using visual thinking in team meetings makes them more interesting. It helps employees understand policies and processes. It explains what the company does, where it is going, who does what within different departments.
Where does visual thinking apply to business management?
Some examples:
- Developing a company vision or mission statement and communicating it to employees
- Making strategic decisions
- Developing a new strategy, communicating it to all departments and employees
- Optimizing processes
- Collaborative brainstorming during team meetings
- Organizing projects
- Training for employees
- Motivating employees
- Organizing meetings
- Summarizing the work of teams
– In my work as a strategic corporate governance leader, I often have to explain the complex challenges we face. In these situations, visualizing and drawing are great tools. They encourage and engage others in the discussion and increase the chances of reaching a common understanding of the problem, says Lene Einang Flach, project coordinator, Norwegian Broadcasting Corporation.[5]
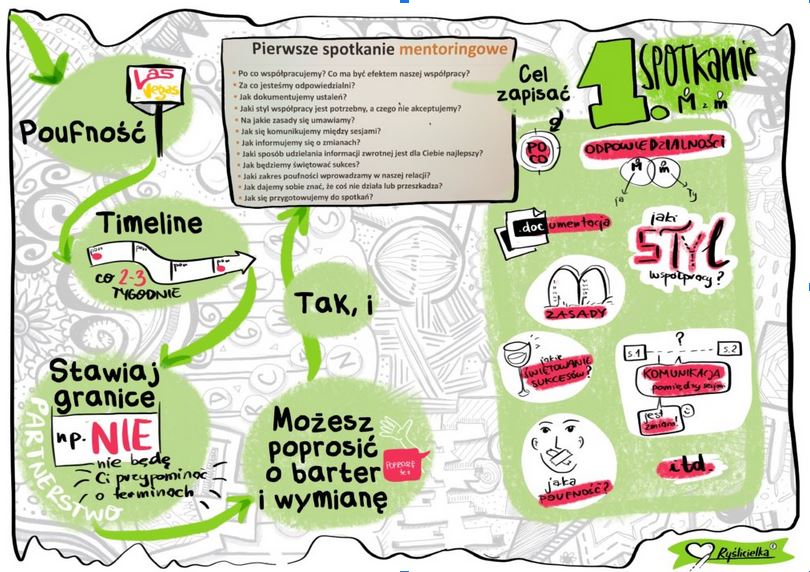
A sample visual memo to help optimize company processes
How visual thinking helps management at A.P. Moller
When the technical department wants to explain what it does to the rest of the company, the other employees often don’t understand anything! And if they don’t understand, how are the company’s customers or business partners supposed to understand…
That’s why the technological innovation department of A.P. Moller – Maersk – the logistics company – took an unusual approach.
It deals with inventing new solutions, testing them, and using pilot projects on a daily basis.
He works with both internal and external teams.
The employees have prepared a visual language to make sure the collaboration goes smoothly and that everyone understands what he does. It contains over 152 words and visuals and is constantly being added to.
Why they did it.
Visuals help explain complex issues in a simple way that everyone can understand. They make abstract concepts and notions take shape.
The innovation department has also prepared a presentation with visualizations to help new business partners of the company understand the innovation process.
– Our visualizations help to engage other departments and explain to them what we do, says Julija Voitiekute, Innovation Portfolio Manager.[5]
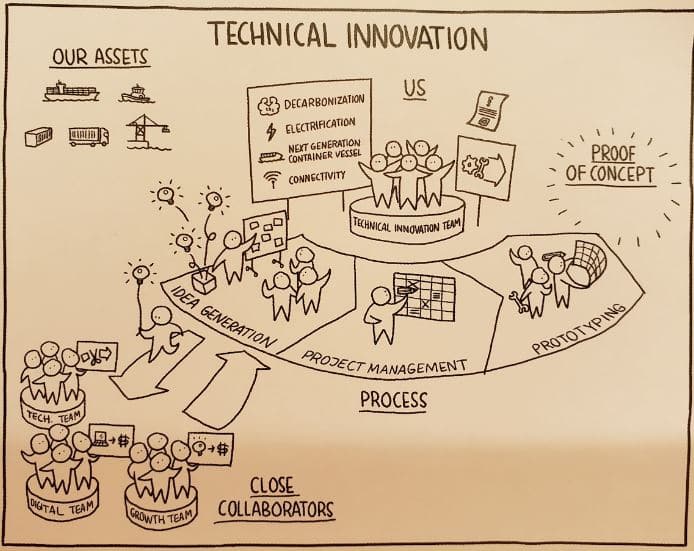
One of the illustrations in A.P. Moller’s presentation illustrates one of the innovation department’s working methods.[4]
Marketing
Where does visual thinking find application in marketing?
Some examples:
- Identifying customer needs
- Setting goals
- Developing marketing plans
- Developing marketing strategies
- Positioning the company against the competition
- Gathering information, research
- Creating concepts of marketing creations
- Creating content plans
- Making sales materials more attractive
Ideas are made visible and accessible for everyone at the same time. Thinking turns into reality and active participation is ignited. Complexity and connection points are explicitly displayed which makes them much easier to understand and remember. Conversations are enabled and collective knowledge grows based on shared reflection and agreements.
How visual thinking helped a company understand complex market analysis
In his book, Dan Roam described the story of his client, Daphne, from a large publishing company that received appallingly bad results in one of the industry surveys.
It wasn’t that the company had bad reviews…it was just that despite its size, people didn’t know about it!
So Daphne hired a brand research agency to get more information.
…and she got too much of it! The data was too much. The executive summary alone took 60 pages!
So she enlisted Dan Roam’s firm to use visual thinking techniques to clearly present the material she received.
As a result, the company prepared a chart that was accompanied by a short presentation.
Daphne presented it to the CEO of her company. Both he and the rest of the employees understood where the problem lay and the market situation.
The CEO asked for a framed copy of the chart and hung it in his room to show others where the company was now and where it was going.[2]
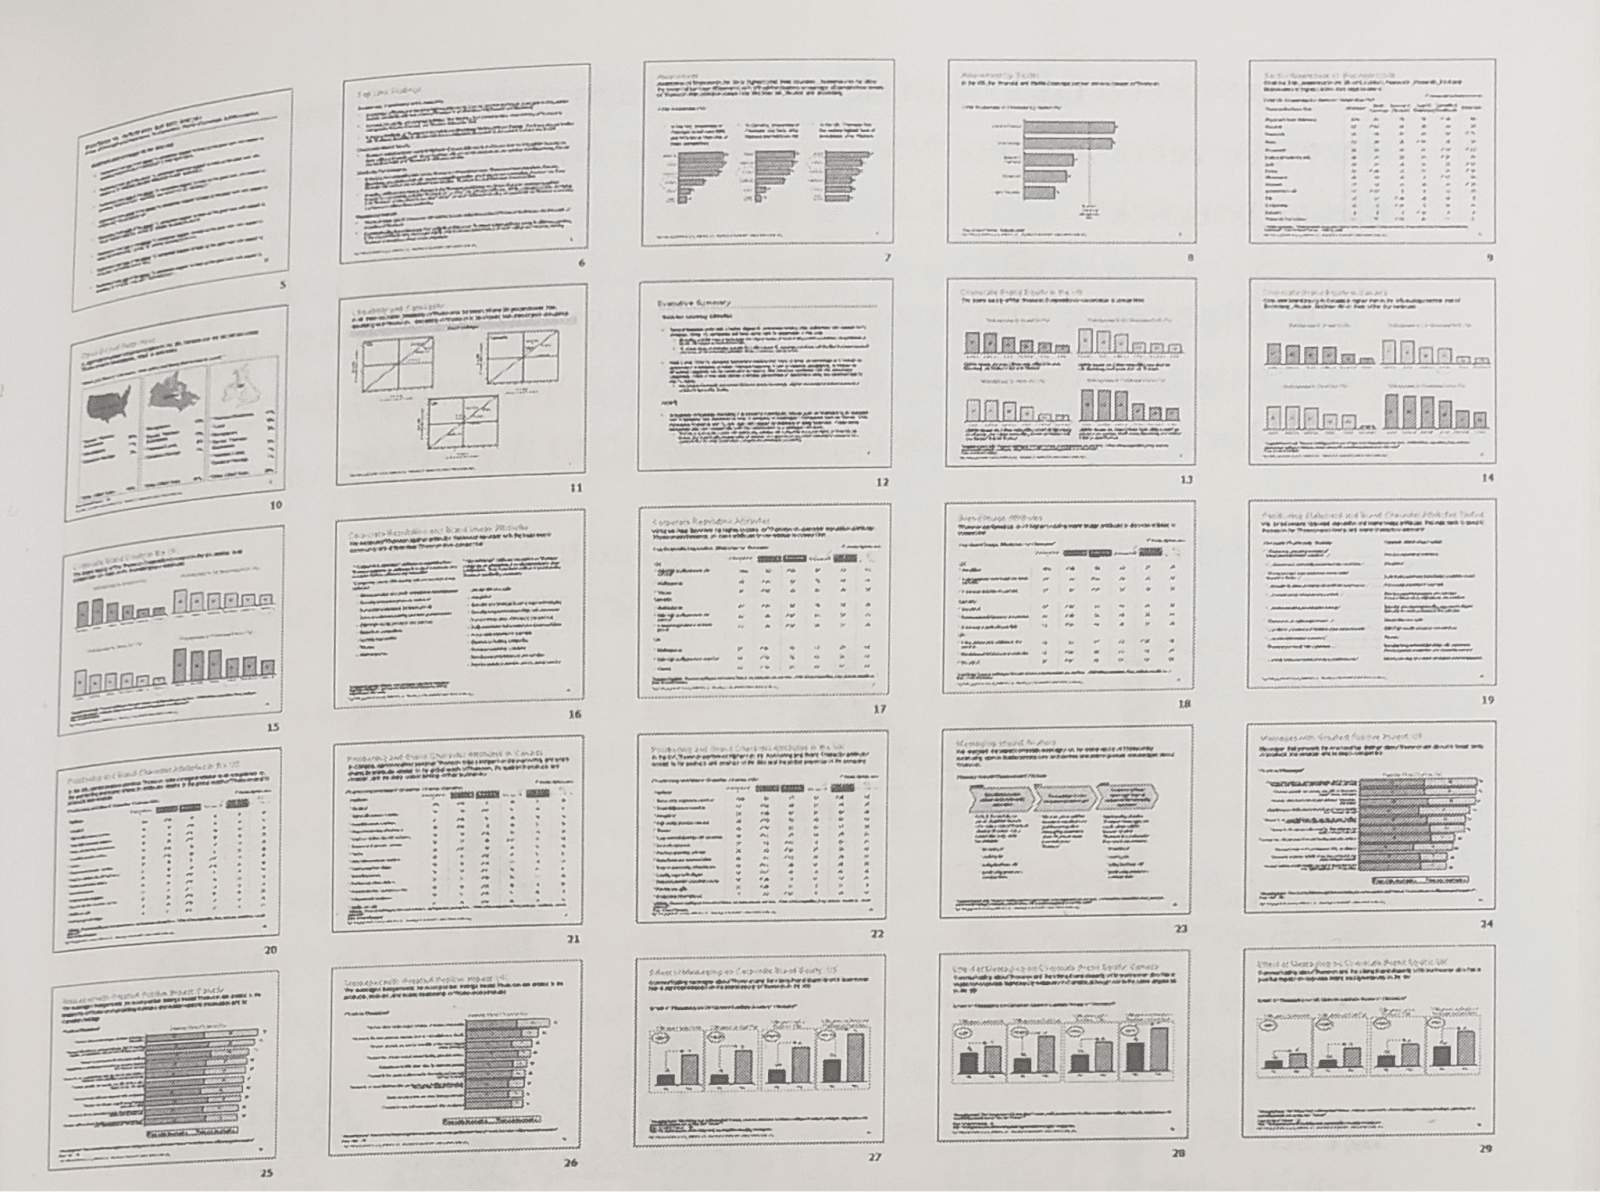
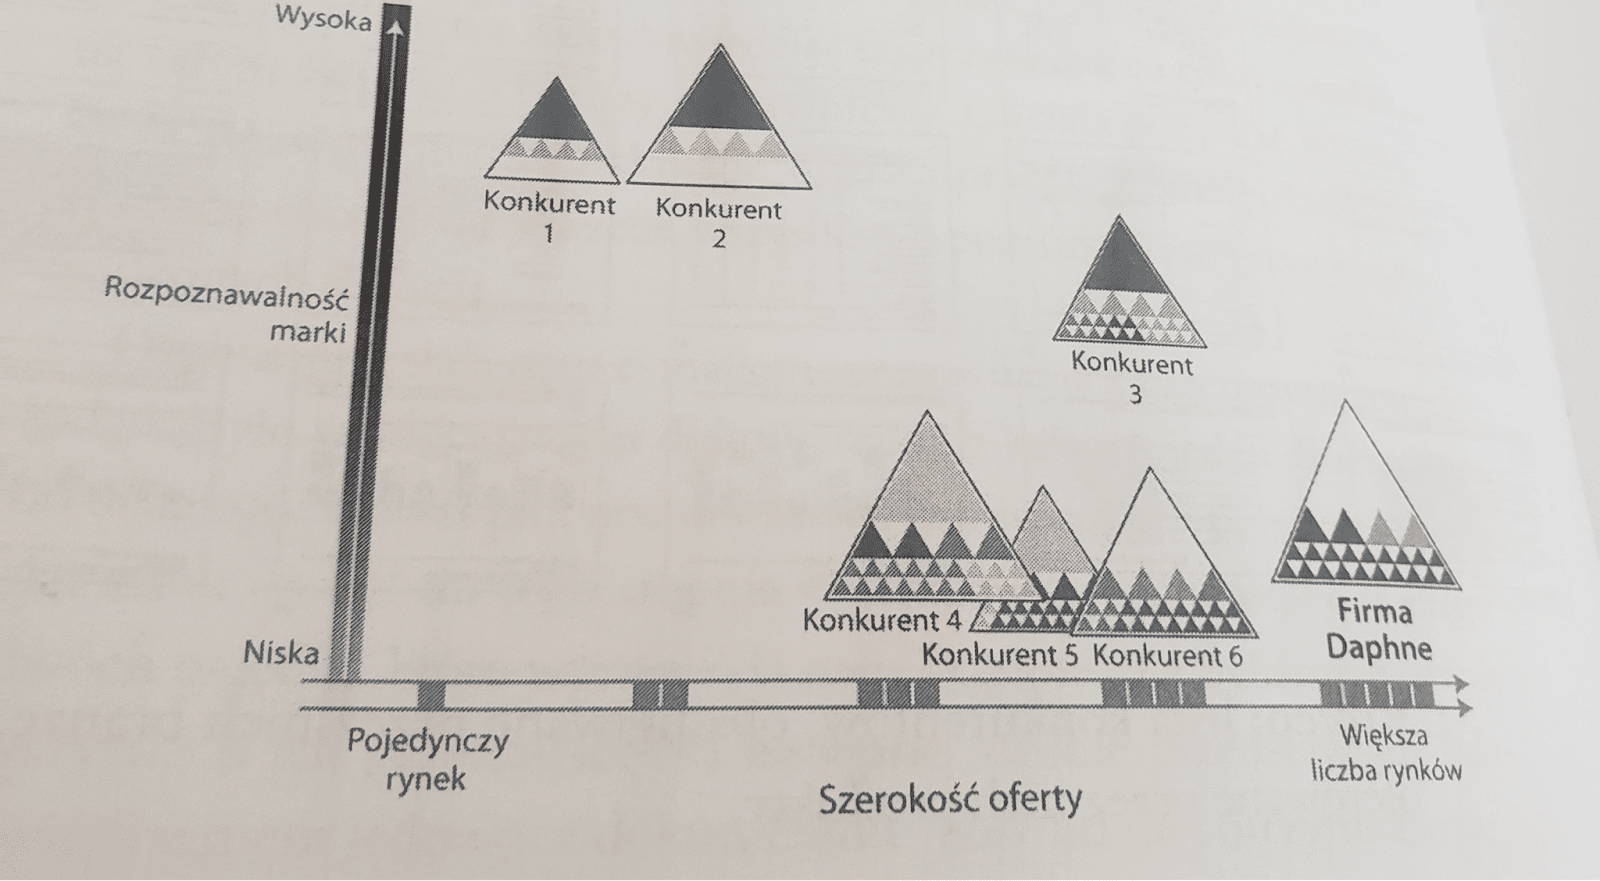
Left: this is just a few pages of a summary of a brand research agency’s analysis. On the right: a chart prepared from dozens of pages of the report. It’s complicated because there’s a lot of data, so to understand it, it’s accompanied by a presentation lasting several minutes. Takes from a Polish translation of the book. Source: Dan Roam, “Narysuj swoje myśli”, 2008
Selling
Where does visual thinking apply in sales? Some examples:
- Presenting a product/service to customers
- Communicating with the customer
- Summarizing sales proposals
- Collecting customer feedback
- Communicating sales call findings to the marketing department
Animation that shows the quality of products and helps sales
Animation for FORTE was made in whiteboard animation style, i.e. drawn by hand. The technique was not accidental. This form of animation shortens the distance between the company and its customers. It is lighter in the reception than vector animation.
To organize the entire production process in the minds of the audience, the most important stages of control were shown at the beginning. They were then developed one by one and explained in the animation.
It was later shown at an international furniture fair.
Animation for FORTE
Product development/production
Where does visual thinking apply in the production process? Some examples:
- Work organization
- Creating prototypes
- Working on new products using design thinking techniques (design thinking necessarily uses visual thinking!)
- Brainstorming
- Instructions (e.g. on how a machine works or how to produce a certain intermediate product in a plant)
- Gathering conclusions
Visual thinking helped Procter&Gamble employees to look at creating new products differently.
A great example of how visual thinking broadens horizons is the story of cooperation between Procter&Gamble and David Sibbet, who described it in his book “Visual meetings. How graphics, sticky notes & idea mapping can transform group productivity”.
The facilitation meeting was about generating new ideas for company products. Sibbet asked the workshop participants to imagine that the whole world is engulfed in an ecological disaster; people have to wear protective clothing and use special cosmetics.
The workshop lasted several days, so I won’t summarize the entire workshop. The concept, however, was that through various techniques using visual thinking, company employees would discover new ideas for products that could be useful in such a world.
What were those techniques? They painted a collaborative mural depicting the world described. They made visual notes in groups and independently on sticky notes.
The workshop generated many new ideas at Procter&Gamble, and the company was able to draw on them long after the workshop ended.[6]
Professional and personal development
Where does visual thinking apply to professional and personal development? Some examples:
- Knowledge and skills mapping
- Presentations (PowerPoint type)
- Task lists
- Mapping out your dreams and plans
- Visualizing your career path
- Defining company, team and personal goals
Klaudia Tolman’s talk at TEDex Wroclaw on using visual thinking in personal development.
Examples of materials that use visual thinking
Below are some examples of materials that use visual thinking to create. I want to emphasize that these are just a few examples, because there are so many manifestations of visual thinking in a company that there are entire books written about it!
Mind map
While creating mind maps we need to write down even the already known, in theory “basic” information. This helps us look at the topic with fresh eyes. Sometimes even from the point of view of our customer or employee…
Visual thinking forces us to rethink issues that are fundamental to us. Questions arise: “How do I present this?”, “What is key to understanding this point?”.
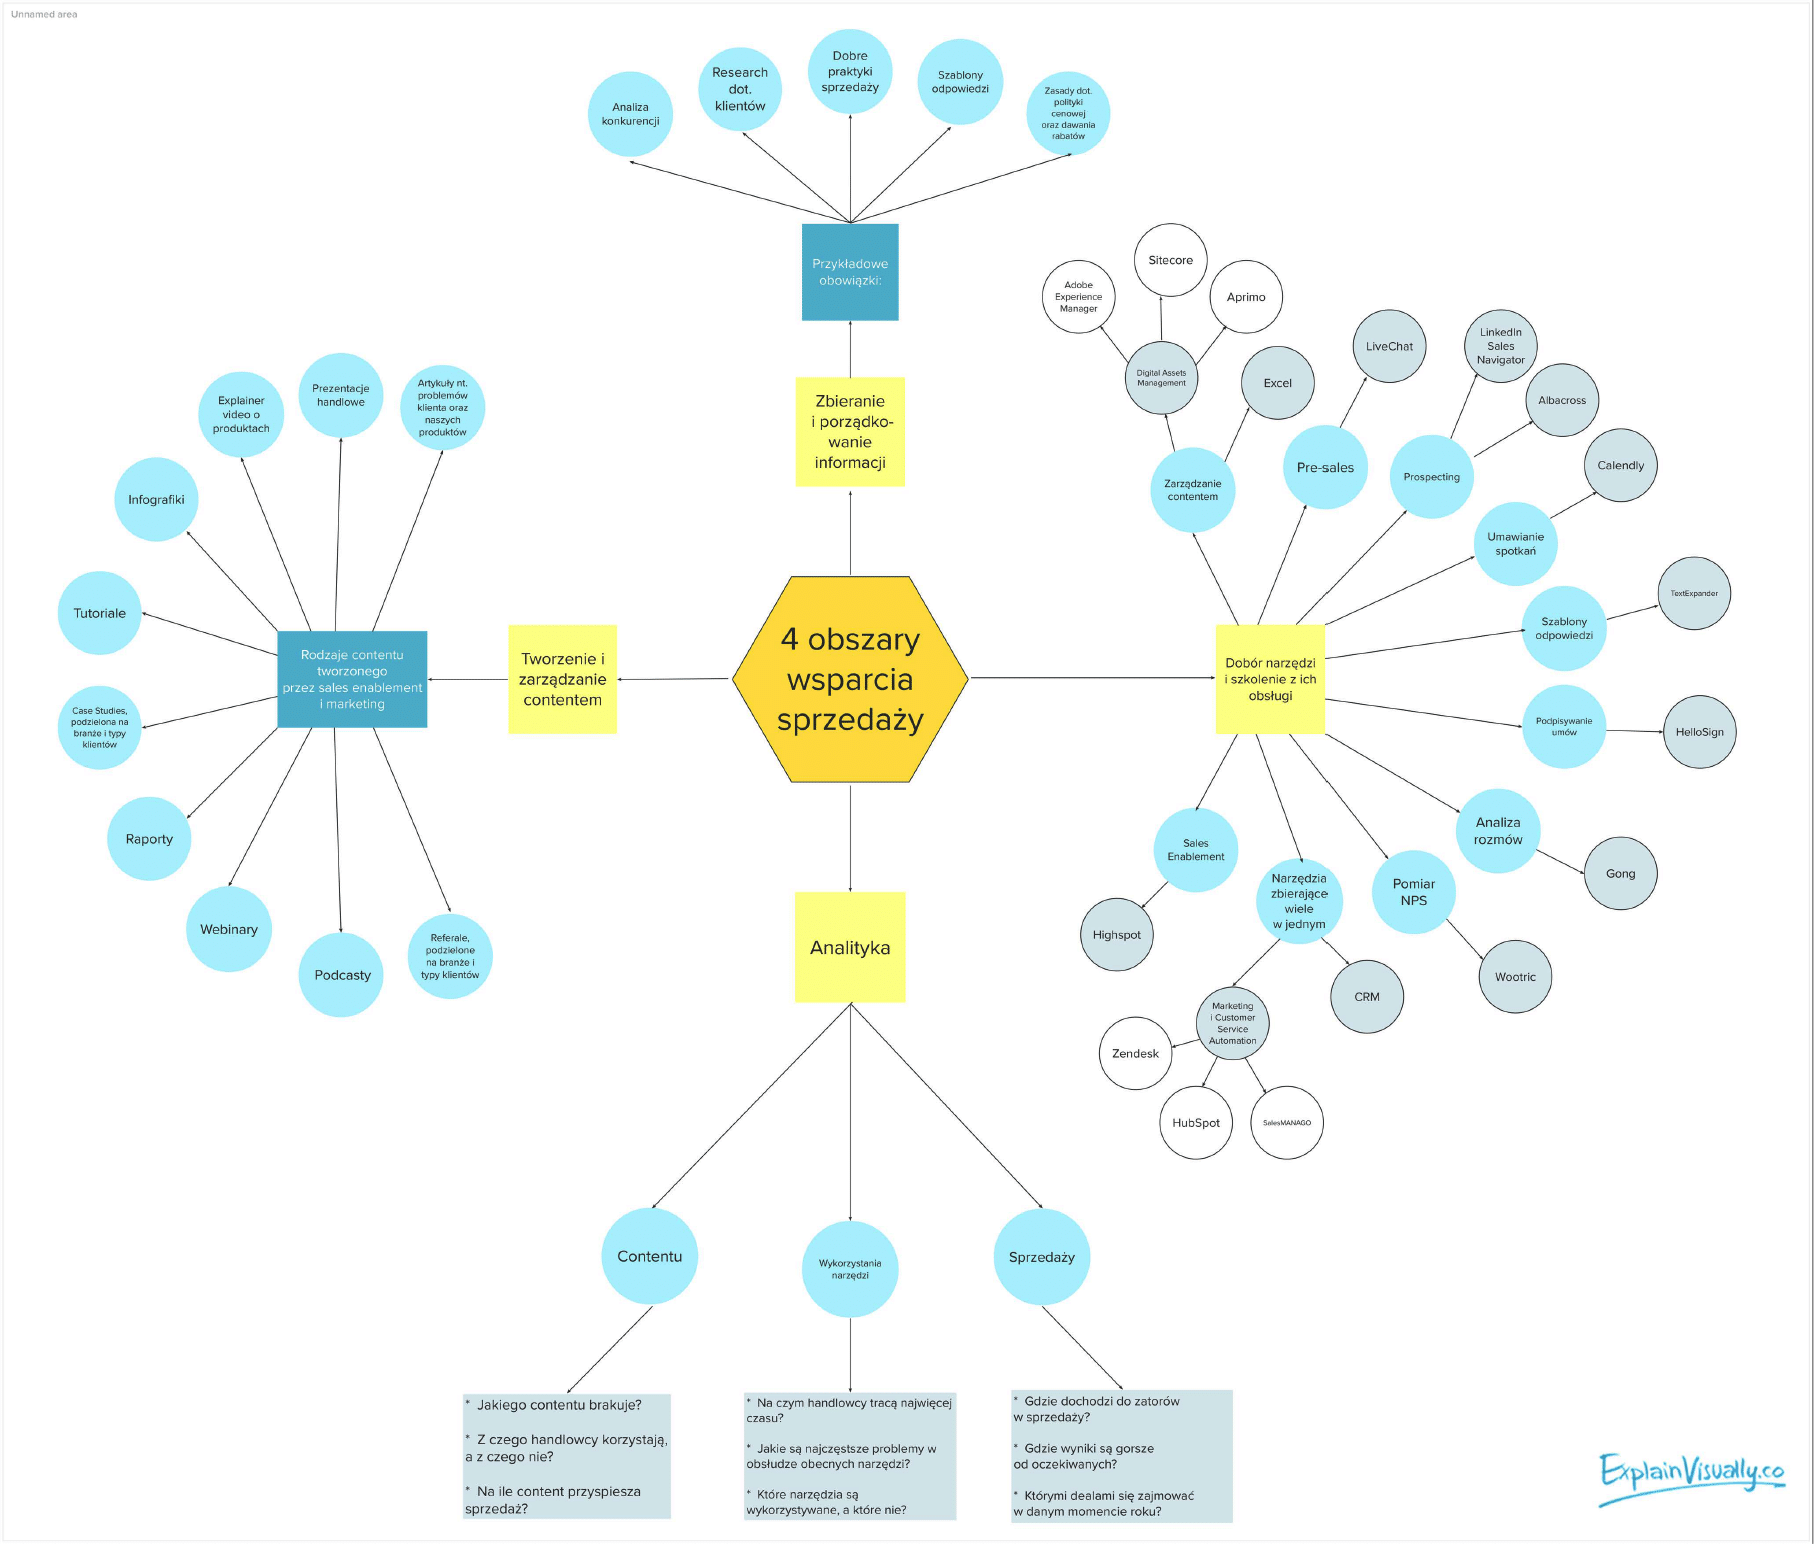
Mind map
Digital Graphic Recording
Digital graphic recording (DGR for short) is digital graphic recording. It is used by large corporations, event and training companies, as well as small businesses.
During business events, nowadays more often webinars or internet conferences, a graphic artist extracts the most important points of a conversation and records them in the form of drawings and the most important text content. Such a note makes it easier for the audience to receive the message, puts it in order. It is also a tangible summary of the meeting, to which participants can later return.
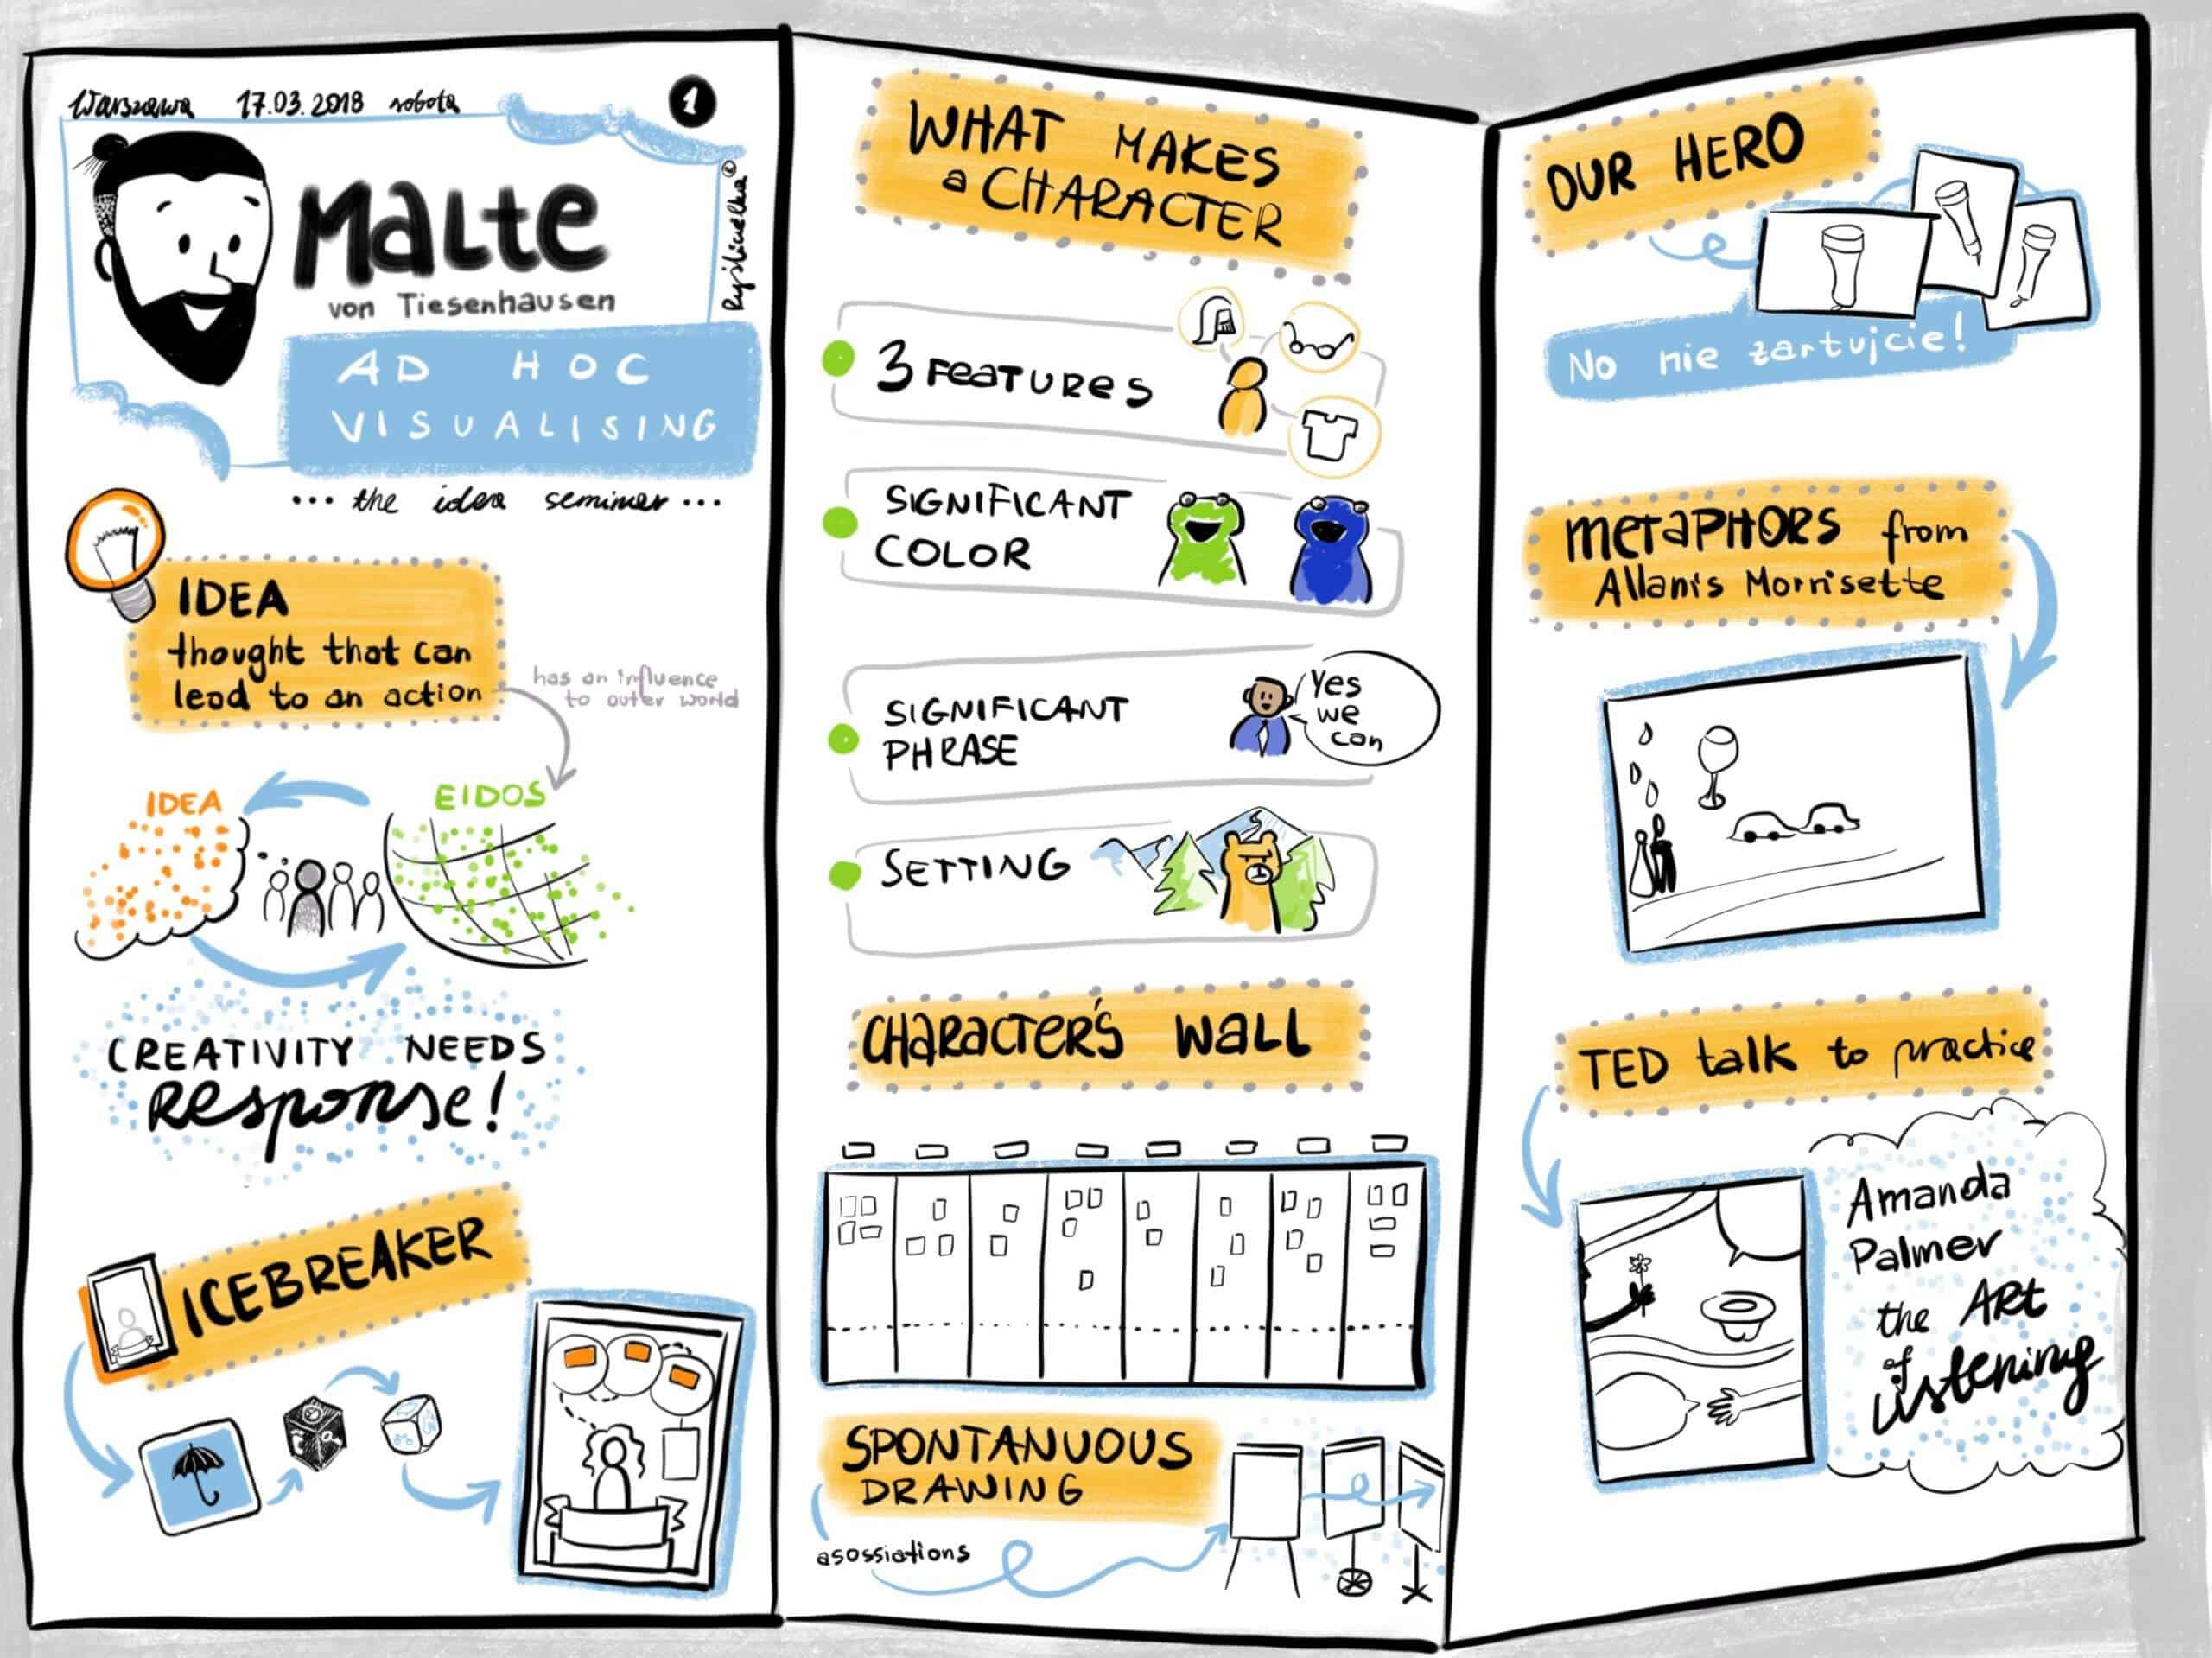
An example of a Digital Graphic Recording
Organising text visually
Bullets, titles and subheadings, bold, icons… anything that helps us organize text is a manifestation of visual thinking.
– I recently took out three insurance policies through mbank. mbank does this in partnership with AXA. When I saw the AXA documents, I was stunned. Everything was beautifully labeled in the contract! They added neat, ascetic vector visualizations that perfectly showed me that this is the date of signing the contract, here is the date of the monthly premium, etc. It made me want to read it. It is a way to meet customer needs and solve the sad problem of the “wall of text” – says Klaudia.
The idea is to visually emphasize certain issues, put them in order, highlight them, sometimes illustrate something with simple drawings or graphic elements.
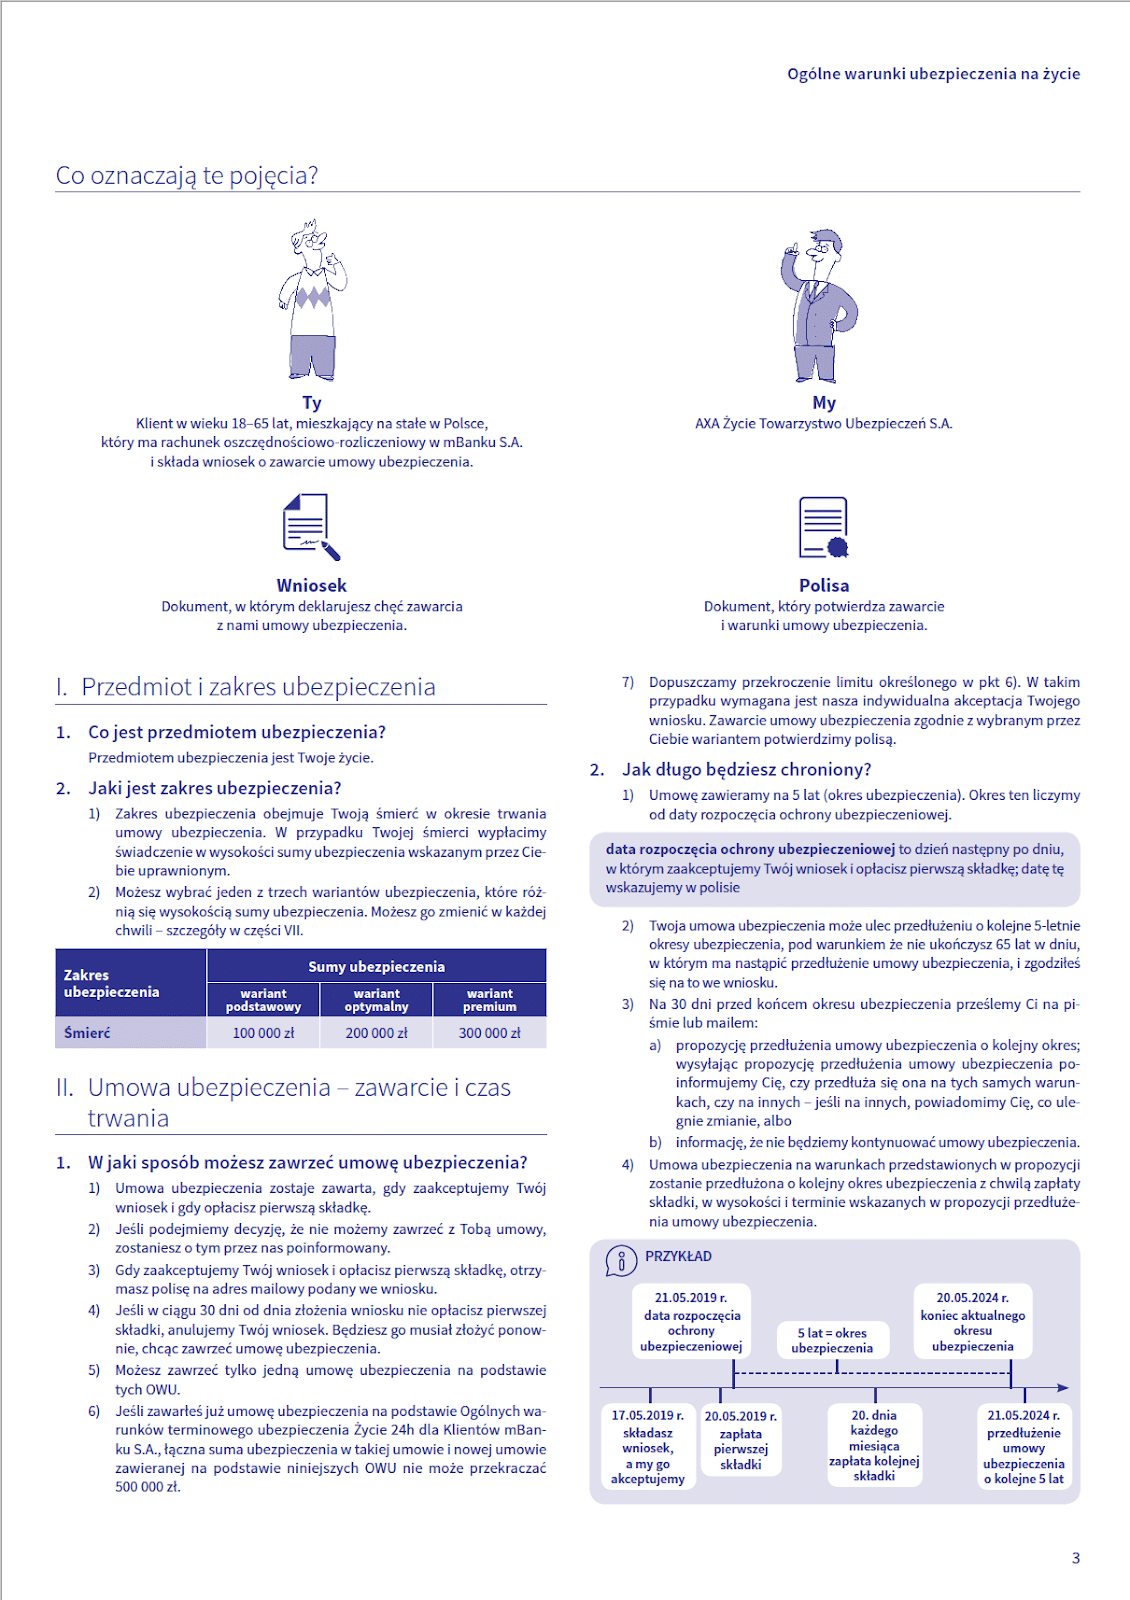
AXA documents
Diagrams and charts
– I feel that so-called visual thinking has become synonymous with such quick hand drawing. It’s bad that it has such a reputation. Visual thinking is such a big collection, in the middle of which drawing on a piece of paper is just such a tiny ball. And then there are symbols, infographics, maps, flowcharts, tables or charts – says Klaudia Tolman.
Let’s not look far… let’s take for example the Gantt chart. It was created about 100 years ago by Henry Laurence Gantt. It was used, among others, in the Hoover Dam construction project in the 1930s or in the Moon flight program in the 1960s[2]. Today it is difficult to imagine managing various company projects without a Gantt chart.
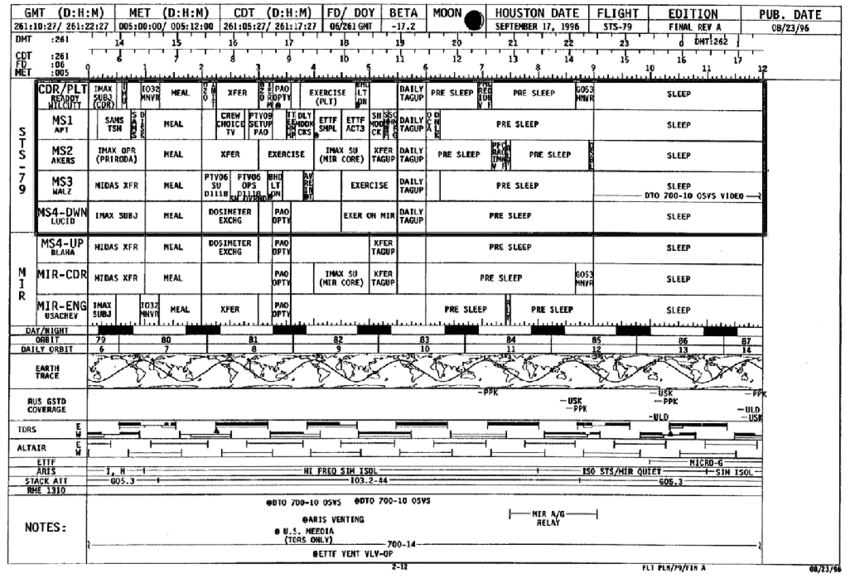
Gantt chart used by NASA, 1996. Źródło: Elizabeth Lerner Papautsky, Valerie L. Shalin, The Advantages of Using Color to Represent Constraints in Collaborative Planning Representations, 2010
Illustrations and infographics
Illustrations and infographics, besides being eye-catching, can complement text very well.
They explain the issues raised by the text message. They sum it up and sometimes complement it.

Our infographic for BPS
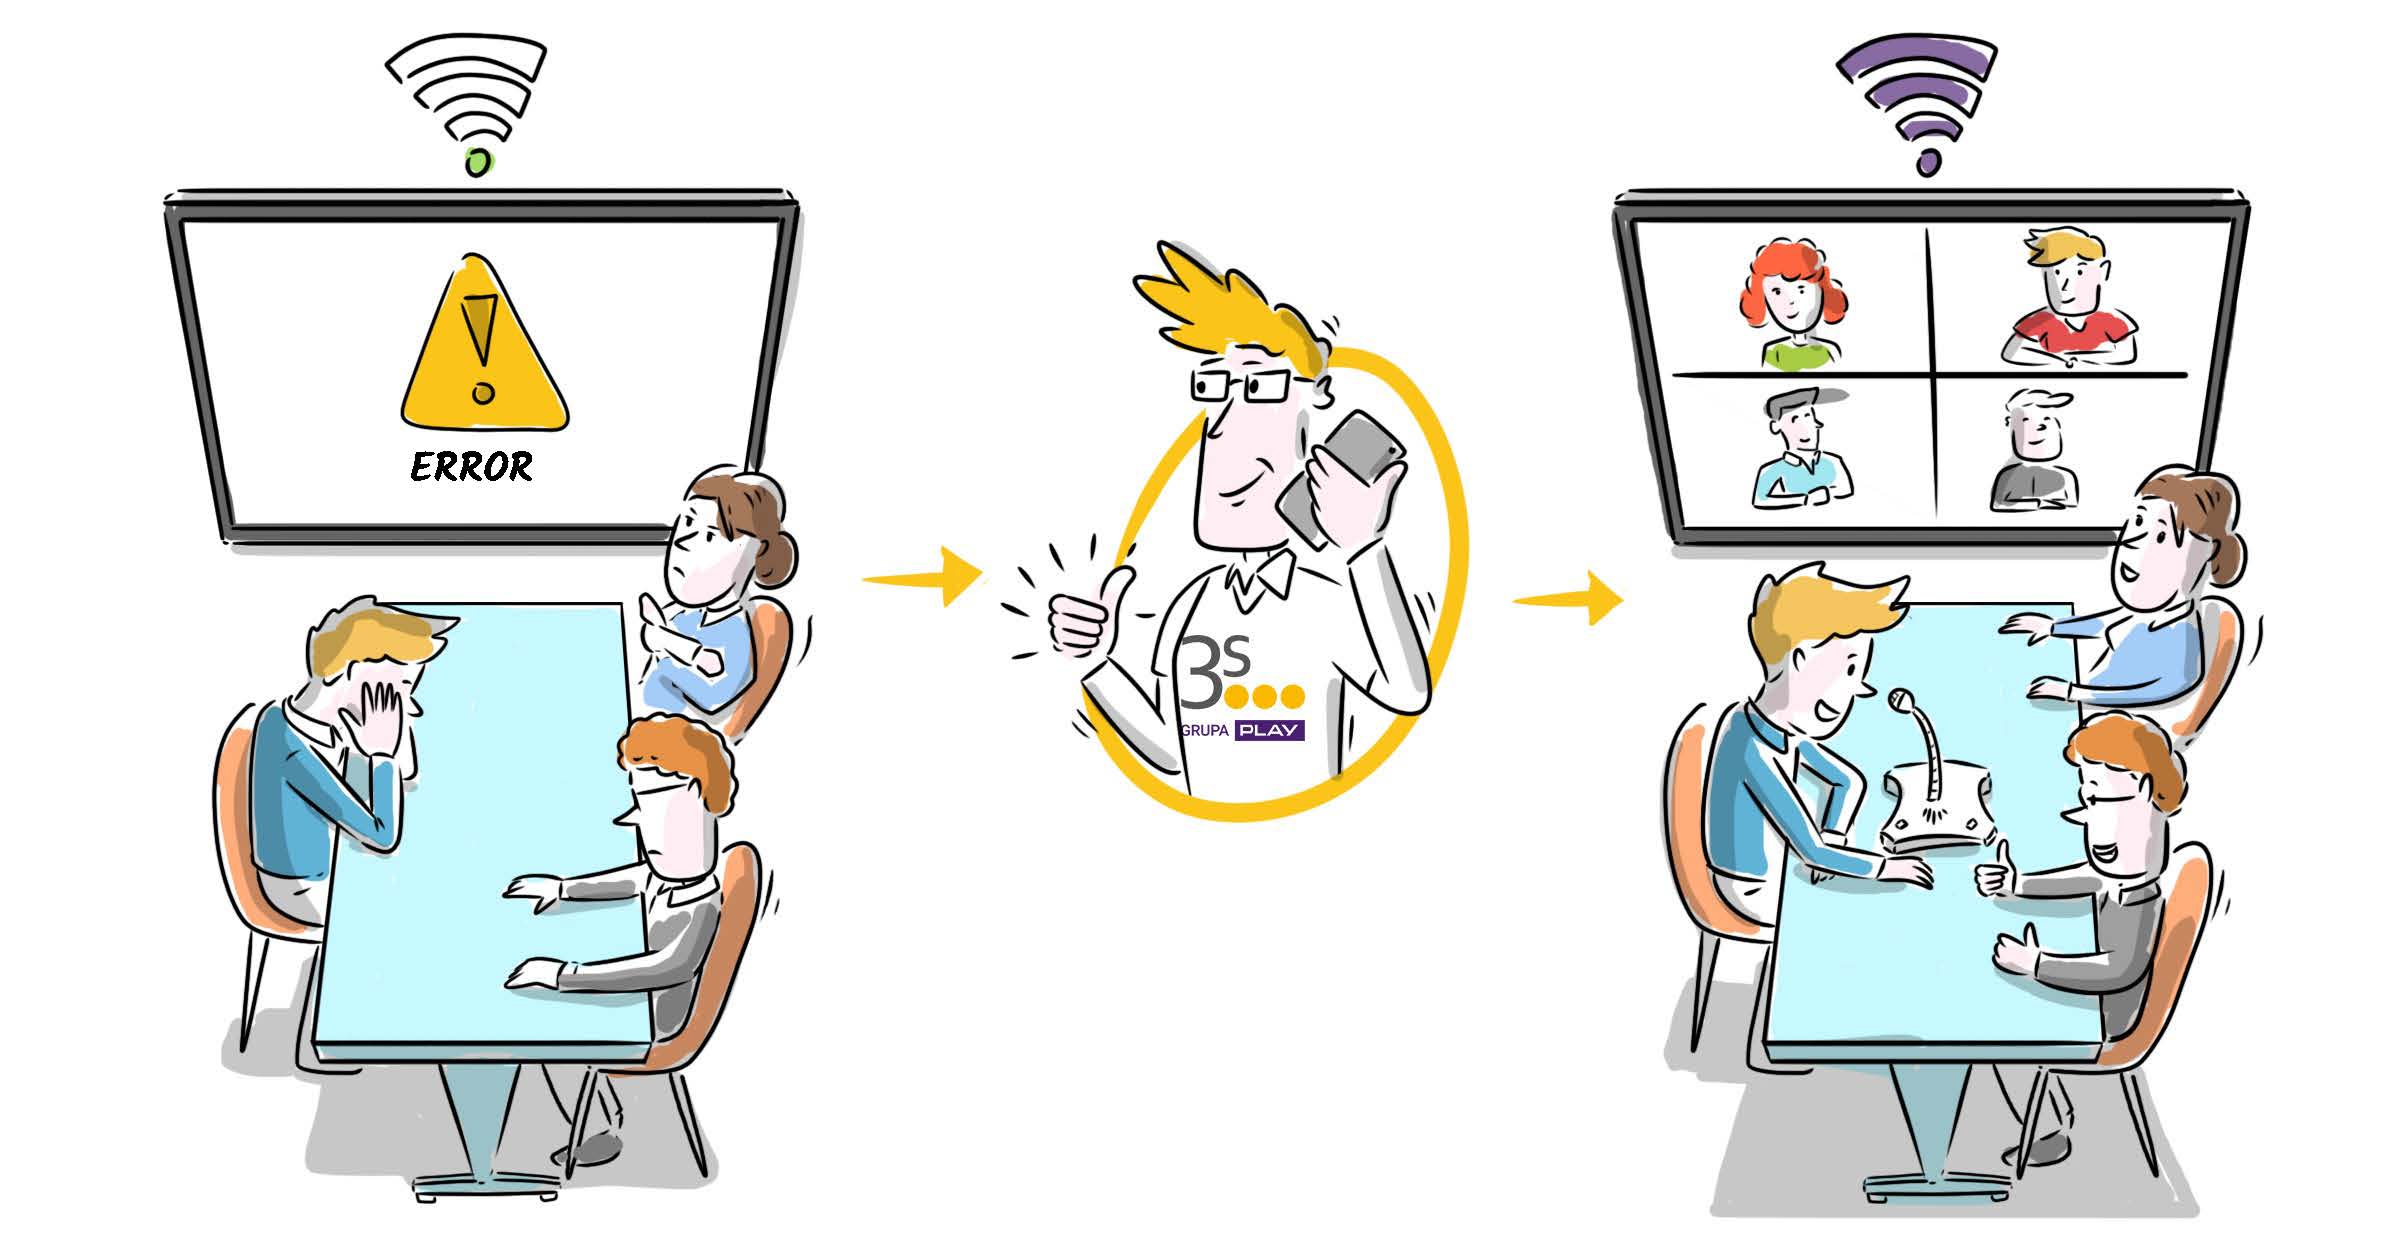
Our illustration for 3S PLAY Group
Animations
Walt Disney said:
Animation can represent anything the human mind can imagine. This ability makes it the most versatile and direct form of communication. At the same time, it is created to be appreciated by mass audiences.
I started my article “Animation versus illustration: which is more effective [based on research]” with this quote.
And I still think it perfectly captures the quintessential advantages of animation.
Animations:
- efficiently convey information;
- engage and hold the audience’s attention; and
- effectively explain company procedures or new strategy.
We have already written several articles about animations. A few of them:
7 examples of explainer video, which provided companies with leads and increased sales
What is whiteboard animation (and how your business can benefit from it)?
Animation for SHARP
Timeline
– Let’s formulate the garage sale rule: even if you keep your garage in perfect order, once you put all of its contents on the street, you will look at everything in a whole new light.
Exactly the same phenomenon occurs with data: information buried in the right catalogs and folders won’t allow you to see the full picture, but gathering all the documents in one place allows you to see patterns and relationships that were previously invisible, writes Dan Roam. [2]
A timeline, among other things, works on this principle. Yes, it is also a manifestation of visual thinking. The timeline organizes events, and allows you to see how much time has passed. It lets you quickly understand WHEN something happened in relation to other events.

Source: Novell
Cartoons
Less frequently used in business, but no less effective – comic books!
Their advantage is that they draw you into the story , add lightness to the content and make the message more digestible.

Coca-Cola cartoon inspiring customers to recycle
Facilitations and workshops on visual thinking
When you see an ad for a “math workshop” you can more or less tell what it might look like in practice. You know what to expect.
What does a “visual thinking” workshop look like?
Let’s start with the purpose of a visual thinking workshop.
– The idea is to show the participants that they can think visually. We draw simple things, shapes and symbols. For example, a paper clip. This is the stage at which doubt arises in hardened heads: “well no, what good is all this to me, am I really supposed to draw a sunflower?”. I am fully aware that this is the case. I guide such people then. I say that I know that it may be associated with going back to kindergarten, but we need this stage – says Klaudia Tolman.
At math workshops we do not learn right away how to apply a generating function or derive complicated graphs. We start with the equation “2+2=4”. Same in a visual thinking workshop. We start with the myth-ridden “sunshine”.
Then the workshop participants begin to picture things from their lives. Private or professional. It could be, for example, a process that is not working in their company. Of course, the topics are adapted to the workshop group.
These drawings then evolve. In the workshop you can learn how to emphasize the most important elements, the chronology of events or the sequence of processes. It could be by drawing using colors.
In Klaudia’s workshops, participants start with two drawing techniques. The first is based on drawing lines. The second is based on five shapes: a dot, a line, a triangle, a square and a circle. And that is enough.
Visual thinking helps to look at things from a different perspective. And in the long run, participants in the workshops look at the materials or guidelines they put out differently.
– They think to themselves, for example, “how can I simplify understanding this? How about I draw a template? It will save everyone time” – adds Klaudia Tolman.
If you want to learn more about Klaudia’s workshop, write us an email: kontakt@klaudiatolman.pl
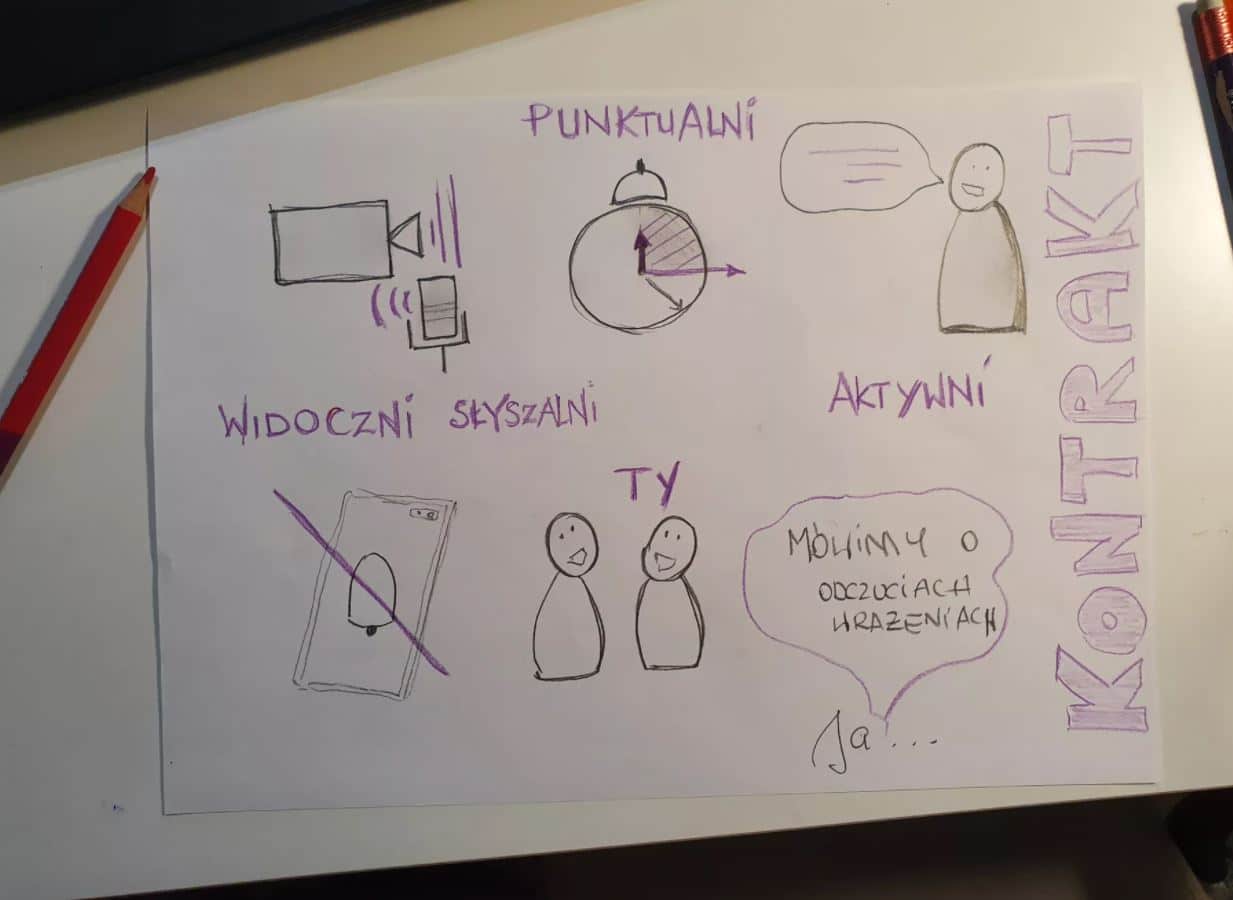
Example of a drawing prepared by a participant during the workshop on visual thinking. Drawings are, among others, the principles of conducting projects, cooperation between people, arriving at common solutions and organization of work.
Summary
We all use visual thinking every day, mostly unconsciously.
However, when you start using it consciously, you can only benefit from it, especially in business.
Visual thinking makes it easier to understand text and remember information. It engages the team, helps generate new ideas in the company and streamlines processes.
Examples of using visual thinking by companies such as mbank, IKEA, A.P. Moller and Procter&Gamble show this.
The list of materials where it can be applied is huge, much bigger than the one presented in this article. DGRs, animations, mind maps, infographics… even this article has elements of visual thinking – proper paragraph division, color-coded interjections, italics in captions, and visual examples.
It’s not a pipe dream. The effectiveness of visual thinking is supported by research, such as that of Professor Richard Wiseman.
If you are interested in using visual thinking to help your business, please contact us.

She studied Japanese and linguistics at the University of Warsaw, but it was her work for an NGO, first as a volunteer, and then professionally, that shaped her interests. As a coordinator of one of the campaigns she organized conferences, meetings at the Parliament, fashion shows, made interviews with politicians and celebrities. She also took care of social media and marketing. Now she is responsible for marketing and running social media at ExplainVisually.
Bibliography
[1] Paivio, A. (1991). Dual coding theory: Retrospect and current status. Canadian Journal Of Psychology/Revue Canadienne De Psychologie, 45(3), 255-287. doi: 10.1037/h0084295
[2] Dan Roam, “Narysuj swoje myśli”, Wyd. One Press, 2008
[3] https://richardwiseman.wordpress.com/2012/10/10/the-power-of-acting-as-if/
[4] https://brella.com/blog/featured-articles/whiteboard-videos/
[5] Visual Collaboration: A Powerful Toolkit for Improving Meetings, Projects, and Processes, Ole Qvist-Sorensen, Loa Baastrup, wyd. Wiley, 2019
[6] David Sibbet, “Visual meetings. How graphics, sticky notes & idea mapping can transform group productivity”, New Jersey
